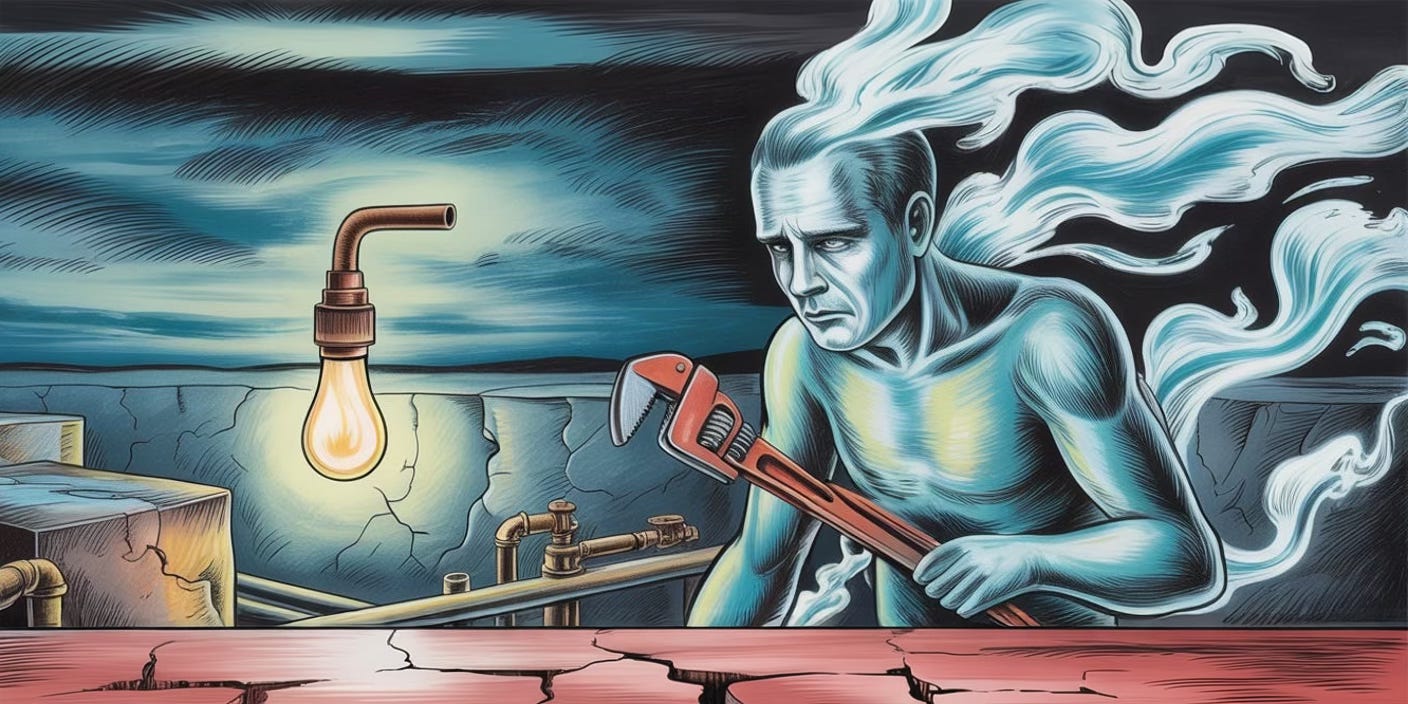
Why Traders Call Natural Gas the “Widow Maker”
Natural gas (NG) is notorious in trading circles. Traders call it the “widow maker” because of how often it destroys well-reasoned strategies. Indicators that work in equities, bonds, or even crude oil often fall apart with natural gas.
The Nickname Goes All the Way Back to the 1990s
The “widow maker” nickname didn’t emerge overnight. It’s been earned through decades of devastating market moves that have wiped out hedge funds, commodity traders, and retail traders alike. The term originated in the energy trading pits of the 1990s, where seasoned traders watched colleagues lose everything on what seemed like “sure thing” natural gas trades.
Unlike crude oil, which tends to move on geopolitical events and global supply-demand dynamics that unfold over weeks or months, natural gas can experience supply-demand imbalances that manifest in hours. A surprise cold front in the Northeast, an unexpected pipeline outage, or even a single weather model revision can trigger moves that would take other commodities months to achieve.
Indicators for Natural Gas Are Not Trustworthy
Our data shows indicators are mostly unreliable. Whether it’s CCI, RSI, moving averages, or roll dates, nothing provides a durable edge. What makes indicator failures particularly devastating is that they often work just enough to give traders false confidence. A momentum oscillator might correctly predict five consecutive moves, leading a trader to increase position size only to get crushed on the sixth trade when the market behaves completely differently.
This is the same psychological mechanism that makes gambling addictive. Traders become convinced they’ve found the “holy grail” indicator, right before natural gas humbles them with a reality check.
The problem compounds when considering that most technical analysis was developed for equity markets, where human psychology drives much of the price action. Natural gas, however, is driven by physical realities: actual molecules of gas that need to be stored, transported, and consumed according to the laws of physics and thermodynamics, not the laws of market psychology. These physical realities of natural gas create a market environment where even perfect information doesn’t guarantee profitable trades. When imperfect information, leverage, and human psychology are added to this mix, the result is a market that has earned its fearsome reputation through decades of destroying trading accounts.
Case Studies in Destruction
The 2021-2022 period provides a masterclass in natural gas volatility. In late 2021, European gas prices went parabolic due to geopolitical tensions, creating sympathy rallies in U.S. markets that traditional analysis couldn’t explain. BOIL went from around $20 to over $80 in a matter of months.
Then came the crash. By mid-2022, warm weather, increased LNG exports, and production growth sent prices plummeting. Traders who bought the “dip” at $60 watched their positions evaporate as BOIL fell below $15. The speed and magnitude of these moves made risk management nearly impossible. Stop losses became meaningless when gaps exceeded 20%.
More recently, the February 2021 Texas freeze provides another cautionary tale. Spot natural gas prices at certain delivery points briefly touched $1,000 per MMBtu — roughly 40 times the normal price. While futures markets didn’t reach these extremes, the psychological impact on traders was profound.
Why NG Defies Prediction
Natural gas is uniquely volatile because:
Weather-driven demand
Cold snaps, heat waves, and hurricanes can flip fundamentals overnight.
Storage and supply shocks
Weekly EIA inventory releases regularly spark double-digit moves.
Seasonality and contract structure
The futures curve amplifies swings through contango/backwardation shifts.
Leverage
Products like BOIL magnify every twist, turning volatility into catastrophic drawdowns or windfalls.
BOIL’s Wild Moves
Over BOIL’s (the ETF that targets 2x daily returns of natural gas futures) history:
Daily swings: as much as +38.9% in a single day, and down nearly –33% in one session.
Weekly moves: rallies topping +70%, crashes beyond –60%.
Monthly swings: gains exceeding +120%, drawdowns over –80%.
Annual extremes: years with 300%+ upside bursts, others with losses wiping out nearly all value.
Risk Management in an Unmanageable Market
Traditional risk management techniques often fail in natural gas markets. Position sizing based on average volatility can be devastatingly inadequate when dealing with a market that regularly experiences 10-standard-deviation moves. Stop losses become meaningless when gaps exceed the stop level by multiples.
Some professional traders have adapted by using options strategies that limit downside risk, but these approaches require sophisticated understanding of volatility pricing and often sacrifice profit potential for risk control.
Conclusion: The Widow Maker
That’s why NG earned its nickname: it punishes anyone who thinks they’ve “figured it out.” The only constant in natural gas trading is uncertainty. For most traders, that makes it less an opportunity than a widow maker.


