
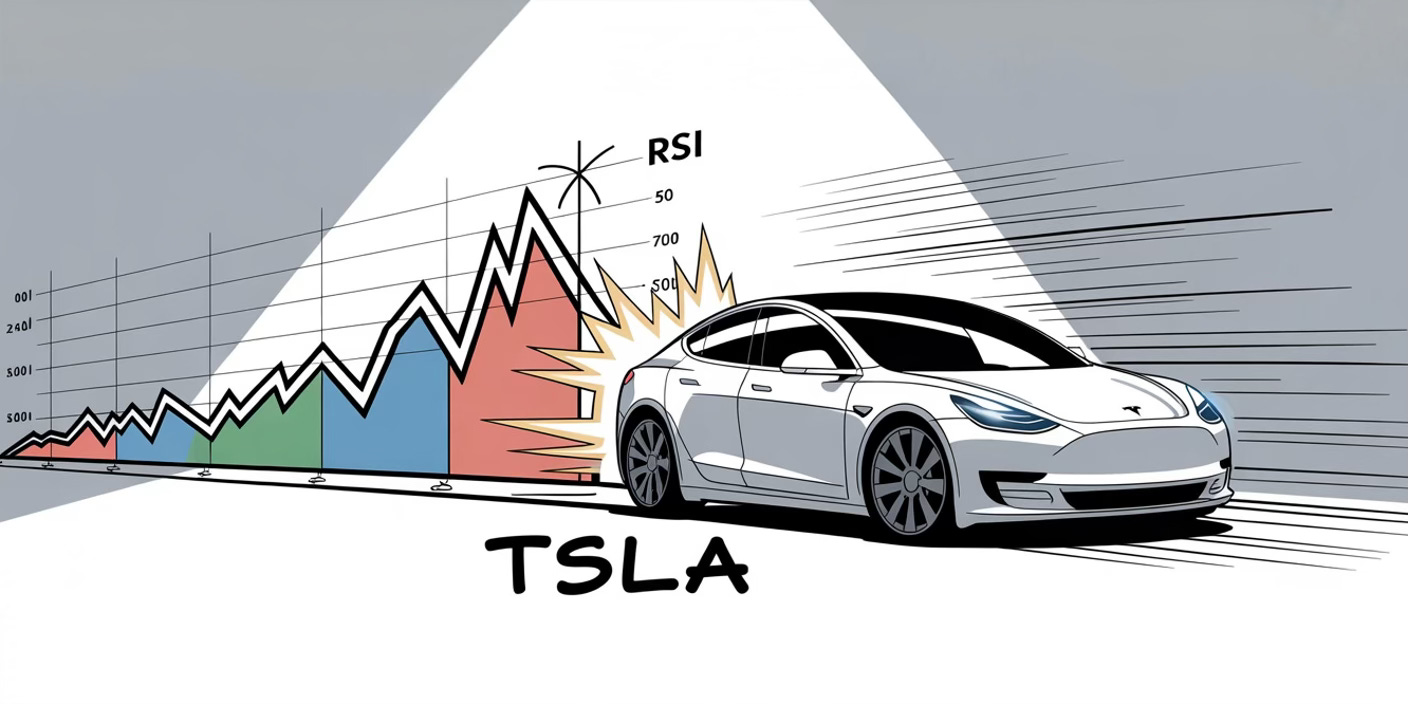
Why RSI Is Overrated — Tesla Tells the Real Story
We looked at what happens one week after TSLA crosses through major RSI thresholds

The Relative Strength Index (RSI) is one of the most popular technical indicators, meant to spot “overbought” and “oversold” conditions. Conventional wisdom says:
Above 70 → stock is overheated, due for a pullback.
Below 30 → stock is oversold, due for a rebound.
But when we analyze Tesla (TSLA) — a highly volatile, momentum-driven stock — the reality is that RSI rarely works as advertised. In fact, crossing down from overbought levels has not reliably predicted bearish outcomes.
RSI Cross-Downs at Key Levels
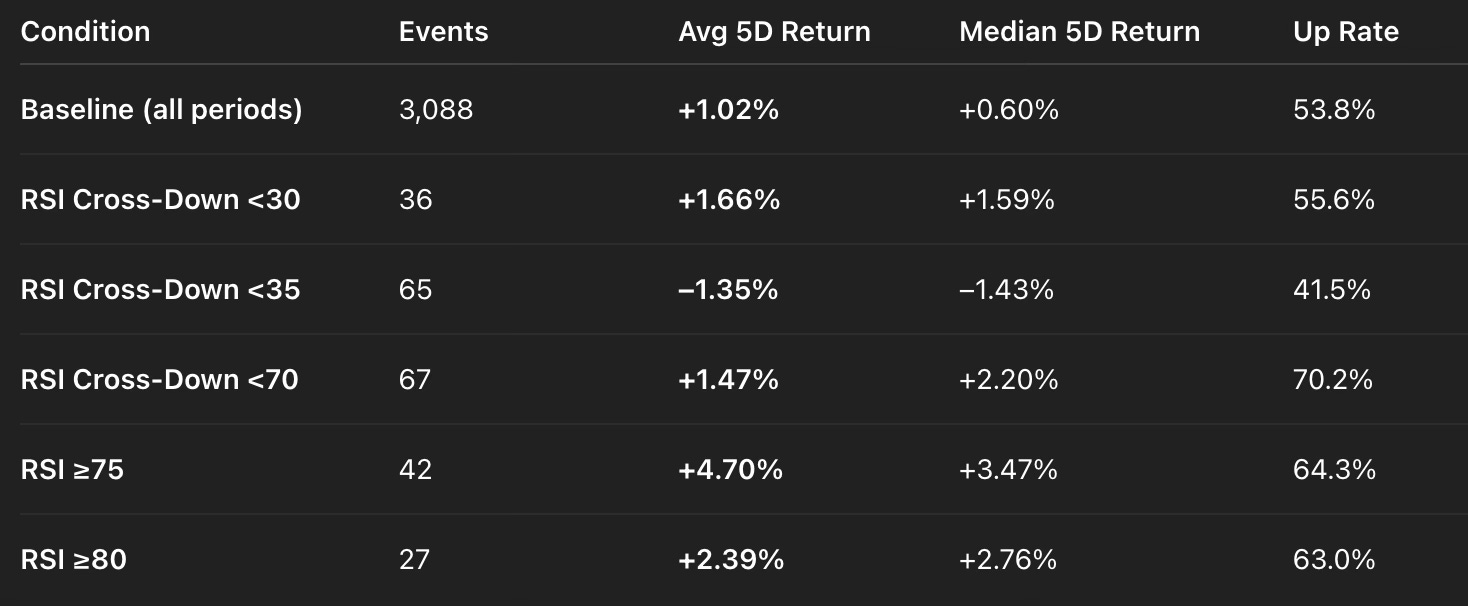
We looked at what happens one week after TSLA crosses through major RSI thresholds (from above to below). If RSI were reliable, we should see consistent weakness. Instead, the results mostly underwhelm:
Crossing below 70
Avg. 5-day return: +2.96%
Win rate: ~69%
Much stronger than baseline (+1.0% average, 54% up rate)
Crossing below 60, 55, 50, 45, 40
Avg. returns: flat to mildly positive, close to baseline
Win rates: ~48–52%, essentially noise
Crossing below 35
Avg. 5-day return: –1.35%
Win rate: 41.5%
Only level with a clear bearish tilt, underperforming baseline
Crossing below 30 (the classic “oversold” zone)
Avg. 5-day return: +1.66%
Win rate: 55.6%
Better than baseline, not worse
In short: the most widely watched RSI signals do not reliably predict drops. Only the 35-level cross-down shows any consistent bearishness, and even that edge is modest.
The Myth of Extreme Overbought Readings
When Tesla’s RSI has surged into extreme “overbought” zones — above 75 (40 events) and above 80 (27 events) — the expectation might be a sharp pullback. But history shows the opposite. One week later, TSLA averaged +2.4% to +2.9% gains, with win rates of 63–65%, compared to the baseline of +1.0% and 54% up rate. The biggest 5-day upside move after an RSI ≥80 reading was +20.5%, while the worst downside was –33.7%, reflecting higher volatility but not consistent weakness. In short, RSI >75 or 80 has functioned more as a momentum confirmation than a bearish reversal signal.
RSI Crashes: When Momentum Collapses
We also tested cases where RSI collapsed by 10 points or more in a single day. Traders might expect this to signal panic and more downside ahead. Instead:
72 events found
+2.19% average return one week later
62.5% win rate
Biggest up move: +36%
Biggest down move: –12.9%
Even larger crashes (≥15 or ≥20 points) leaned more bullish, not bearish. RSI collapses more often mark capitulationthan continuation.
Why RSI Fails as a Crash Predictor
Momentum persists. Tesla often rides RSI >70 or >80 while continuing to rally. Selling too early means missing the strongest gains.
Oversold ≠ bearish. Crossing below 30 historically leads to rebounds, not breakdowns.
Sharp drops = exhaustion. A collapsing RSI often signals that selling is already spent.
Lack of context. RSI ignores volatility, market regime, and catalysts — it’s just a math formula on price.
Key Insights for Traders
Crossing below 70 is not a reliable sell signal. On average, TSLA outperforms baseline afterward.
Crossing below 35 is the only level with bearish bias. Everything else is neutral or bullish.
RSI >75 or 80 is not bearish. These “extreme” levels historically reinforced momentum.
Sharp RSI collapses are contrarian. They usually precede rebounds.
RSI is better as a sentiment gauge than a trade trigger.
Conclusion
Despite its popularity, RSI is overrated as a predictor of stock drops. Tesla data shows that crossing down through “overbought” levels like 70 or even 80 is not bearish — in fact, it often precedes more upside. True bearish signals only emerge at far lower levels, and even then, the edge is weak.
For traders, the takeaway is clear: RSI should not be used in isolation. It can help frame sentiment, but relying on it to call tops in high-volatility stocks like TSLA is a recipe for missed opportunities and false alarms.
