

The CBOE’s VIX9D tracks implied volatility over just the next nine calendar days, making it more sensitive to immediate market jitters than the standard VIX, which looks out 30 days. Some traders treat VIX9D as a canary in the coal mine assuming that when it jumps while VIX stays calm, broader volatility is about to follow.
We tested that assumption using thousands of daily observations. The verdict? VIX9D doesn’t predict VIX movements in any meaningful way.
What We Found
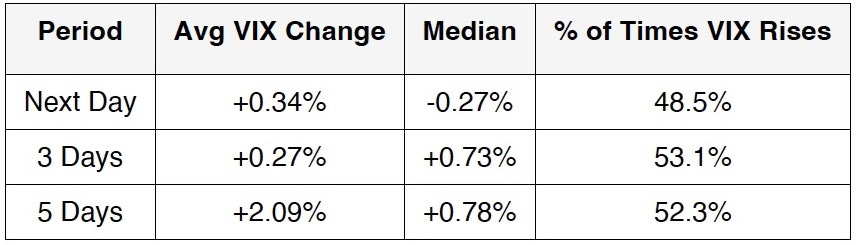
Using 3,083 trading days of paired VIX9D and VIX data, we isolated days when VIX9D rose while VIX fell:
This divergence happened only 130 times (4.2% of all days)
The next day, VIX was just as likely to fall as to rise
Even five days later, VIX averaged only a 2% gain with a median below 1%
In other words, no edge. No predictive power.
What About Big VIX9D Spikes?
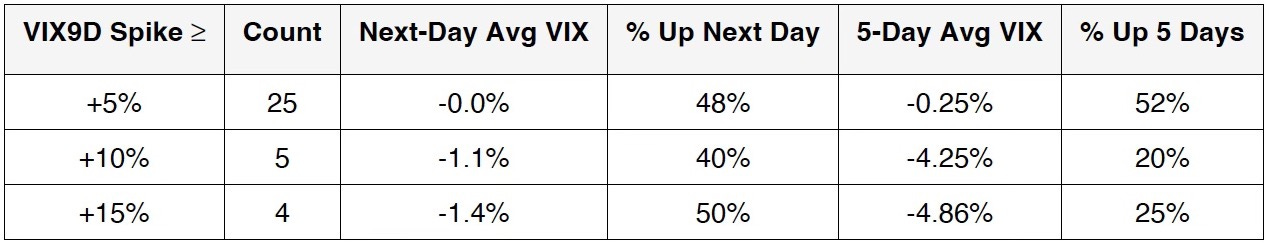
When VIX9D spikes over 5% without VIX joining in, it’s usually not a warning sign either. Traders pile into short-dated options ahead of known catalysts like Fed meetings, CPI releases, or major earnings reports. Once the event passes, implied volatility deflates quickly, often taking both VIX9D and VIX lower together.
What This Means for Traders
If you see VIX9D climbing while VIX holds steady or declines, don’t assume volatility expansion is imminent. More often than not, it’s just traders hedging a near-term event that will resolve without lasting impact.
For a clearer read on market volatility, focus on more stable indicators: VIX itself, VVIX (the volatility of volatility), and the shape of the VIX futures curve. Short-term divergences between VIX9D and VIX are typically noise.