

If you’ve ever heard the term “fear gauge” on the news, they were almost certainly talking about the VIX. For traders and investors, the VIX is one of the most important tools for understanding market sentiment. Even if you’ve never used it before, learning how it works can help you make better trading decisions.
The VIX really is like a thermometer for the stock market.
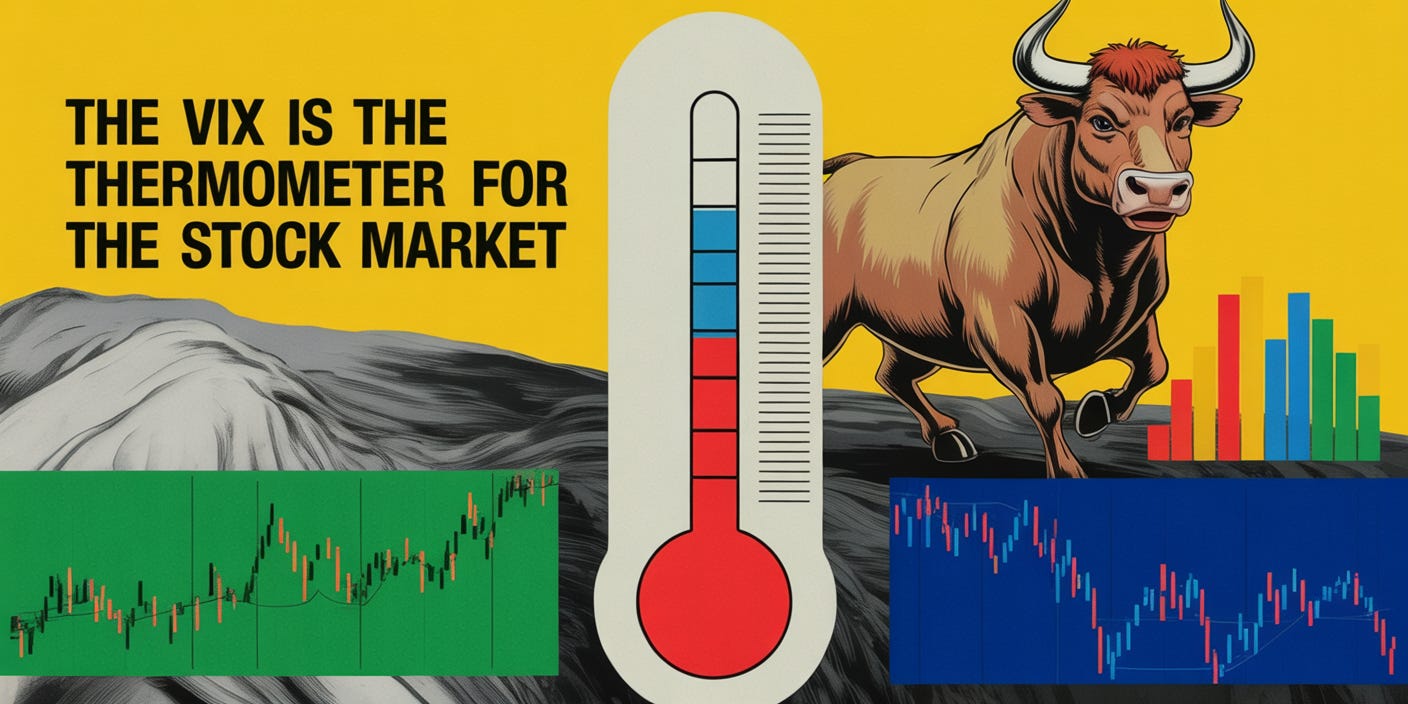
Just as a thermometer measures the temperature in the environment, VIX measures the “emotional temperature” in the stock market. When investors are calm and confident, the market runs “cool” with low VIX readings. When fear and uncertainty spike, the market runs “hot” with elevated VIX levels.
What Do the Numbers Mean?
VIX below 15: Very calm. Investors are confident. But sometimes this signals complacency, meaning risk may be underappreciated.
VIX between 15 and 20: Normal, healthy market conditions.
VIX between 20 and 30: Investors are nervous. This range often lines up with market pullbacks.
VIX above 30: Fear is high. Volatility is likely. These levels usually occur during corrections, geopolitical shocks, or economic stress.
VIX above 40: Panic. These extreme levels often coincide with market crashes (2008 financial crisis, March 2020 COVID crash).
Why Should Traders Care About the VIX?
1. Market Sentiment Check
The VIX gives you a quick read on how investors are feeling: confident, cautious, or fearful. This can help frame your trading day.
2. Risk Management
When the VIX rises, markets tend to get choppy. That means wider stop-losses may be appropriate. When it’s low, conditions are calmer, but risk can be hidden.
3. Market Timing
The VIX often acts as a contrarian signal:
Very high VIX readings often occur near market bottoms (when fear peaks).
Very low VIX readings can occur near market tops (when complacency peaks).
4. Hedging and Protection
Options get more expensive when the VIX is high. Traders use the VIX to decide when to buy or sell calls and puts or when to enter volatility products.
How to Use the VIX in Everyday Trading
Check it daily: Add the VIX to your watchlist, just like you do with the S&P 500 or Nasdaq. It’s a quick snapshot of sentiment.
Adjust your style:
If the VIX is low, trending strategies often work better.
If the VIX is high, markets whip around.
Respect extremes: If the VIX shoots above 30 or 40, know that volatility can persist for weeks. Be cautious if you don’t know how to use volatility to your advantage.
Be Aware of Extremes
Watching it daily can help traders understand whether the market environment is calm, cautious, or panicked.
For beginners, the most important lesson is to be aware of the extremes. When the VIX is extremely low, risk is often underestimated. When it’s extremely high, panic often marks opportunity.
By learning to interpret the VIX, everyday traders gain an edge in reading the market’s mood and preparing for what comes next.