


Our VIX Spike Risk Indicator analyzes historical VIX behavior under similar market conditions to forecast future spike probabilities.
IMPORTANT: This indicator must be applied to the VIX chart (CBOE:VIX) to function correctly.
Dual-Filter Pattern Matching
By combining current VIX and VVIX levels as dual filters, it identifies historical precedents and calculates the probability of VIX spikes over the next 1, 5, and 10 trading days.By requiring BOTH metrics to match historical levels, the indicator creates more precise market condition filters than using VIX alone. This dual-filter approach significantly improves predictive accuracy because:
VIX alone might be at 15, but VVIX can tell us if that 15 is stable (low VVIX) or explosive (high VVIX)
High VVIX + Low VIX often precedes major spikes
Low VVIX + Low VIX suggests sustained calm
VIX Customization Settings:
Uses relative percentage matching for consistency across different VIX regimes
Example: VIX at 15 matches 13.5-16.5 (±10%)
Can switch to absolute tolerance (±5 points) if preferredVVIX Customization Settings:
Uses absolute point matching as VVIX scales differently
Example: VVIX at 100 matches 90-110
Can switch to relative percentage if preferred
Display Metrics Explained
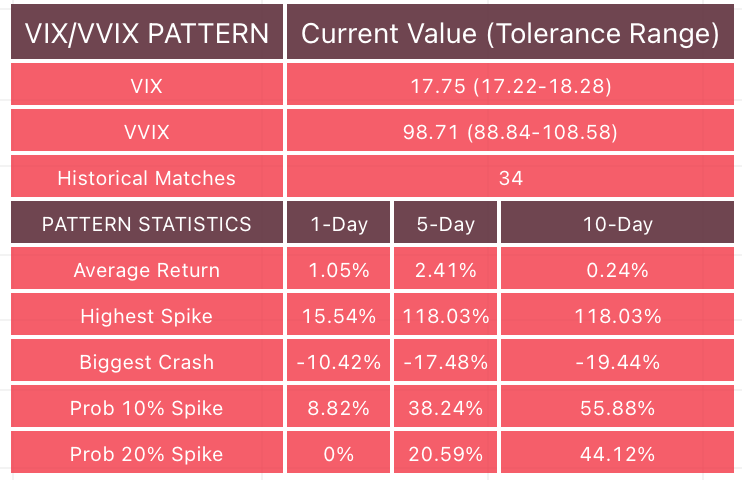
Average Return - On average, what happened to VIX after these patterns appeared.
Highest Spike - Shows the biggest VIX jump that happened after this pattern.
Biggest Crash - Shows the largest VIX drop that happened after this pattern. If it shows -18%.
Prob 10% Spike - What percentage of the time did VIX spike by at least 10%?
Prob 20% Spike - What percentage of the time did VIX spike by at least 20%?