


Imagine you’re looking at Natural Gas today at $4.32 with the CCI at 126. You’re wondering: “What usually happens next when conditions look like this?”
This indicator answers that question by scanning years of historical data to find every single time Natural Gas was around $4.32 with CCI around 126, then shows you exactly what happened in the next 5 and 10 days during those times.
It’s like having a time machine that says: “Hey, we’ve seen this exact setup 23 times before, and here’s what happened...”
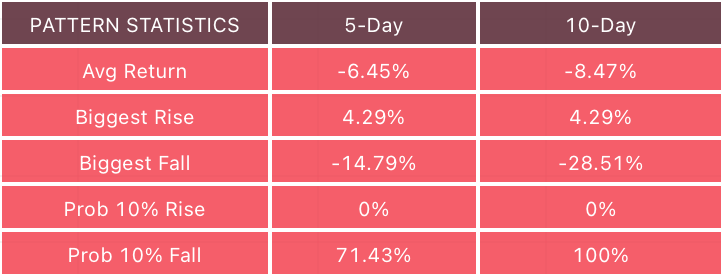
This indicator analyzes historical patterns in Natural Gas futures based on current price and CCI levels to predict future price movements. It identifies similar historical conditions and provides statistical analysis of what happened next, including average returns, biggest rises/falls, and probability of significant moves.
The table shows three main sections:
PATTERN STATISTICS - Based on all historical matches
LAST YEAR SAME DATE - What happened last year around this date
5-YRS SAME DATE - Data across 5 years for this date

Available Customizations
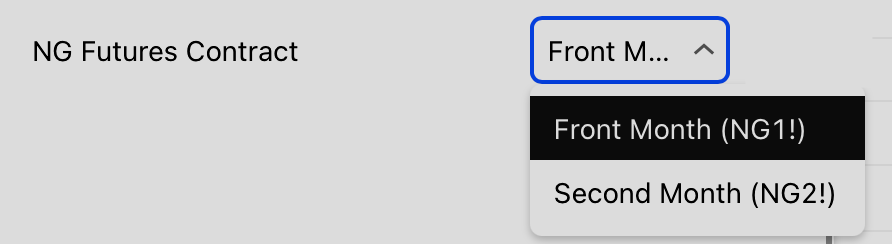
Use Front Month (NG1!) or Second Month (NG2!) Futures
NG Price Settings
Absolute dollar tolerance for price matching
Example: If NG is $3.00 and tolerance is 0.50, matches $2.50-$3.50Use Relative Tolerance (%)
Switch between absolute and percentage-based toleranceNG Relative Tolerance %
Percentage-based tolerance for price matching
Example: If NG is $3.00 and tolerance is 10%, matches $2.70-$3.30
CCI Settings
Include CCI in pattern matching or use NG price only
CCI Level Tolerance (+/-)
Absolute tolerance for CCI matching
Example: If CCI is 100 and tolerance is 20, matches 80-120CCI Use Relative Tolerance (%)
Switch between absolute and percentage-based CCI toleranceCCI Relative Tolerance %
Percentage-based tolerance for CCI matchingCCI Length
Period for CCI calculation
Standard: 20 is the classic CCI settingCCI Source
Options: Close, Open, High, Low, HL/2, HLC/3, OHLC/4
Price source for CCI calculation
Lookback Period
Highlight Historical Matches
Show blue background on bars where conditions matchedShow Seasonal Statistics
Display “Last Year Same Date” and “5-Yr Same Date” sections
Use Case: Disable to focus only on pattern statistics.