We studied every time the VIX has crossed 20 from below since 1990, and tracked whether it went on to hit 30 before falling back under 20. Here’s what we found.
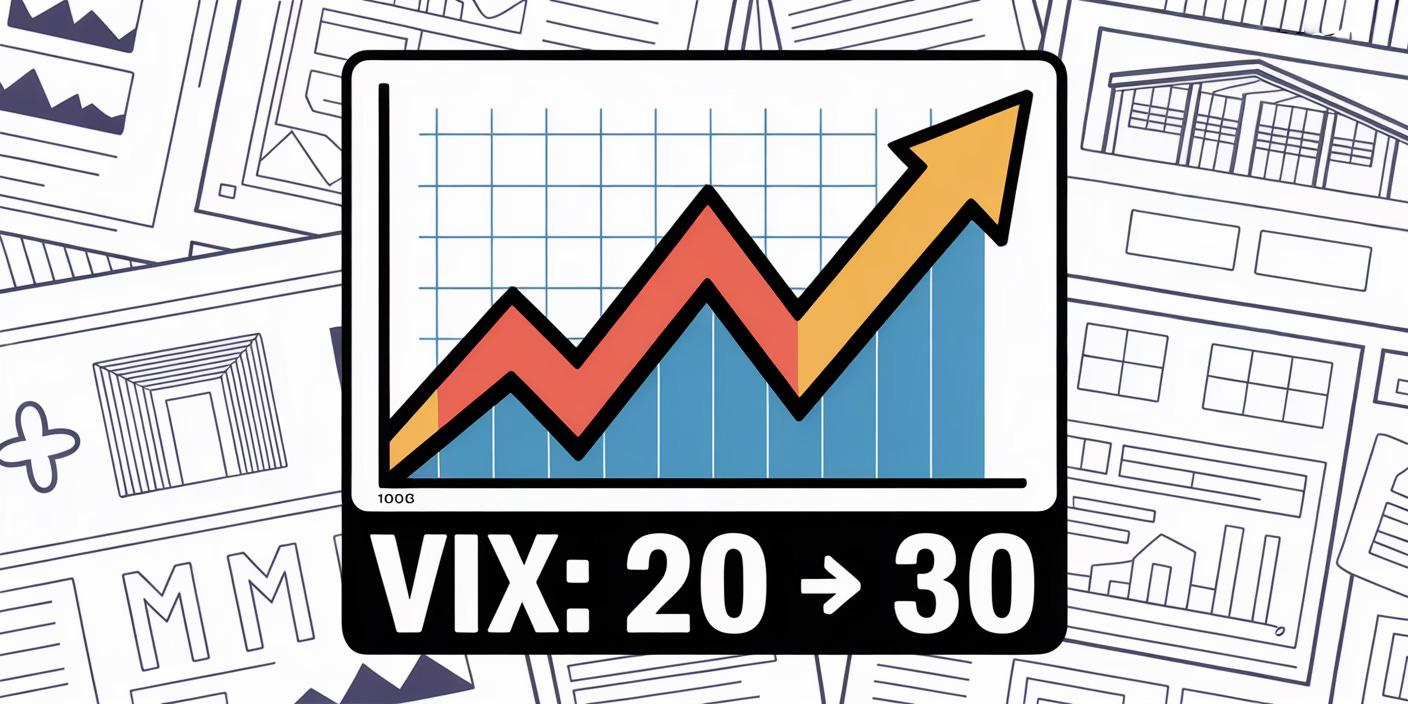
When the VIX Crosses 20: How Often Does It Reach 30?
The VIX, Wall Street’s “fear gauge,” is famous for its violent spikes in times of market stress. Round-number thresholds like 20, 30, and 40 serve as emotional markers for traders and risk managers.
But here’s the real question: once the VIX first crosses 20 from below, how often does it actually go on to hit 30 before falling back under 20?
Methodology
To avoid double-counting, we looked only at clean runs where the VIX:
Was below 20,
Crossed above 20 for the first time, and
Either hit 30 or dropped back below 20.
That way, each run above 20 is counted once, not padded by multiple 30+ closes within the same episode.
This explains why the number of 20→30 runs looks low compared to the raw count of days with the VIX above 30. Since 1990, the VIX has closed above 30 on 735 individual days, but only 24 distinct runs from 20→30 ever happened.
Key Findings: 20 → 30
Total runs crossing 20 from below: 242
Runs that reached 30 before falling back under 20: 24
Probability: ~9.9% (~1 in 10)
Most excursions above 20 never build into major volatility spikes. Only about 1 in 10 make it to 30.
How Long Does It Take?
For the 24 successful runs:
Average time: ~9.6 trading days
Median time: 8 days
Fastest: 1 day (Aug 2015, Aug 2024)
Slowest: 29 days (Mar–Apr 2000, dot-com bust)
If the VIX is going to reach 30, it usually does so within 1–2 weeks. Lingering in the low 20s without momentum is a sign it will likely fizzle out.
Beyond 30: Higher Thresholds
From the same 20-crossing runs:
20 → 40: ~4%
20 → 50: ~1%
Big spikes into the 40s and 50s are extremely rare, almost entirely linked to crisis events (2008, 2020).
Day-to-Day Predictability
Escalations happen fast — if the VIX doesn’t run in the first 1–2 weeks, odds fall sharply.
Day-to-day direction is a coin flip, but the window of risk is short.
Traders should treat a cross above 20 as a yellow flag, not a guaranteed escalation.
What Traders Can Learn
Crossing 20 ≠ guaranteed panic. Most spikes fade before 30.
Speed matters. If the move is real, it will happen quickly.
Crisis context counts. The rare escalations almost always coincide with major macro shocks.
Use as context, not signal. This analysis helps frame risk expectations, not predict day-to-day trades.
Fade the Spike With Patience (Short Vol at Extremes)
Not all VIX >20 runs reach 30. Many stall out and revert back under 20.
Once fear spikes and markets stabilize, advanced traders short volatility ETFs (UVXY, UVIX) or sell call spreads on them.
Timing is key: fading too early can be disastrous.
Rationale: Most volatility spikes are short-lived. Selling into elevated fear (once catalysts pass) is historically profitable.
Term Structure Monitoring (Contango vs. Backwardation)
Above 20, the VIX futures curve often flattens or inverts (backwardation).
Advanced traders monitor this shift:
If still in contango → stay cautious with long vol.
If in backwardation → long volatility trades have higher odds of working.
Rationale: Futures structure is often a more reliable signal than the spot VIX itself.
Conclusion
Crossing 20 is common, but reaching 30 is not. Only about 1 in 10 runs above 20 reach 30, and when they do, it happens fast — usually within two weeks. For traders, the signal is less about timing entries and more about understanding that while fear can spike suddenly, it usually burns out before escalating into a full-blown crisis.


