The following analysis examines silver’s price behavior over the past one year (roughly January 2025 through late January 2026), based on daily and weekly returns.
5 Key Takeaways from Daily Data
Short-term bullish regime (more up days + bigger average ups)
The reward-to-risk ratio looks attractive on most days (1.99 / 1.65 ≈ 1.2).
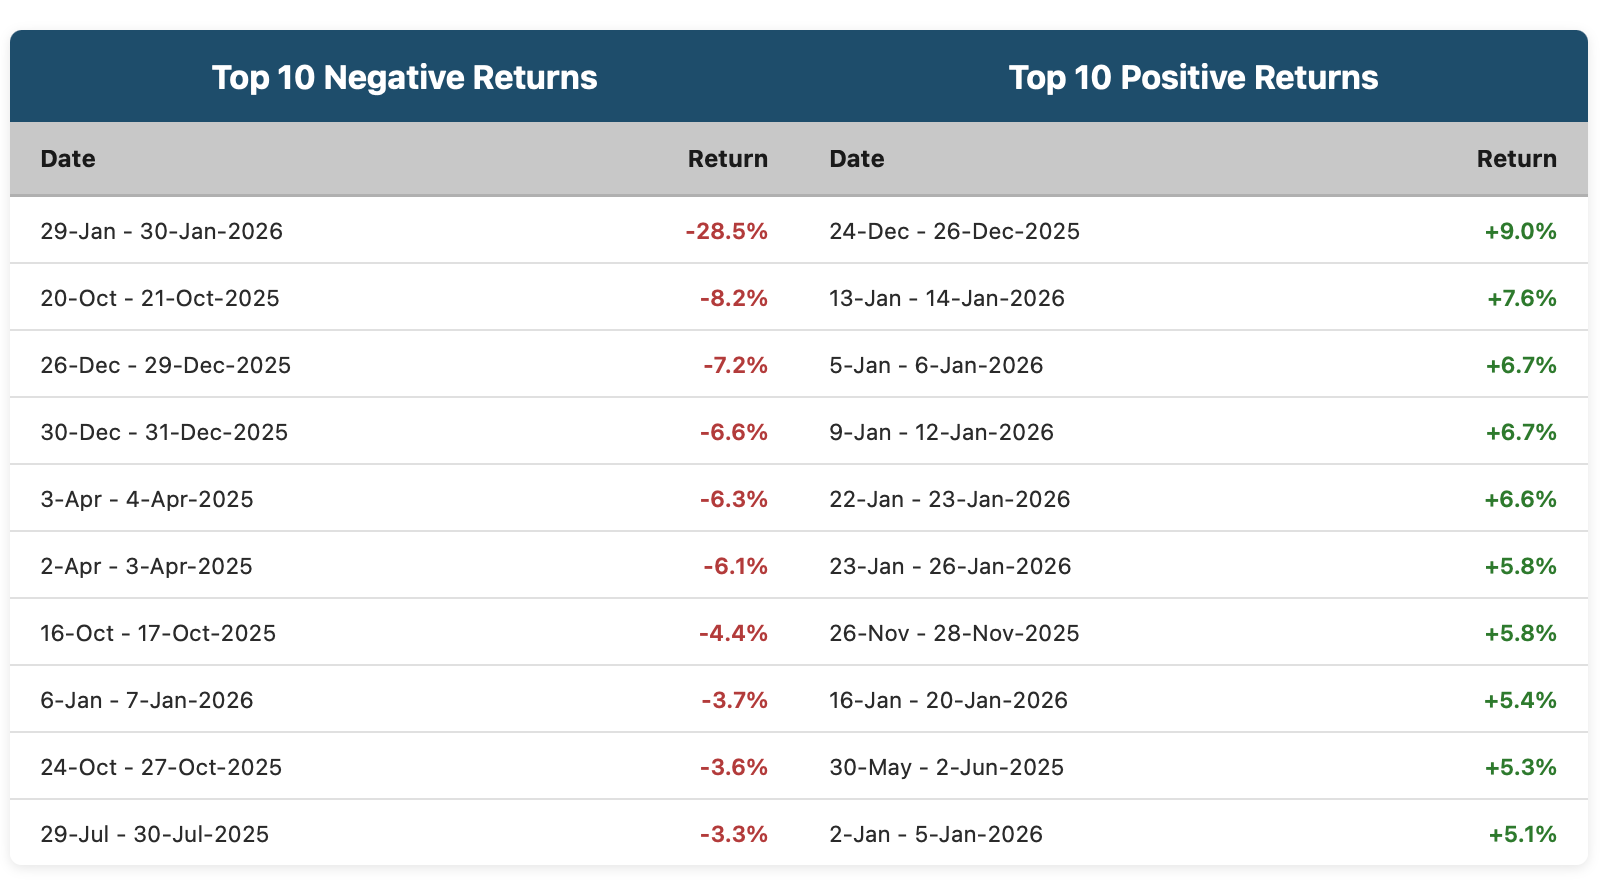
Recent period (late 2025 – Jan 2026) shows extreme two-way volatility — 9 of top-20 extremes (positive + negative) happened in a ~2–3 month window.
Momentum has been bullish, but fragility is rising (clustered big moves + monster downside print).
5 Key Weekly Takeaways & Comparison to Daily View
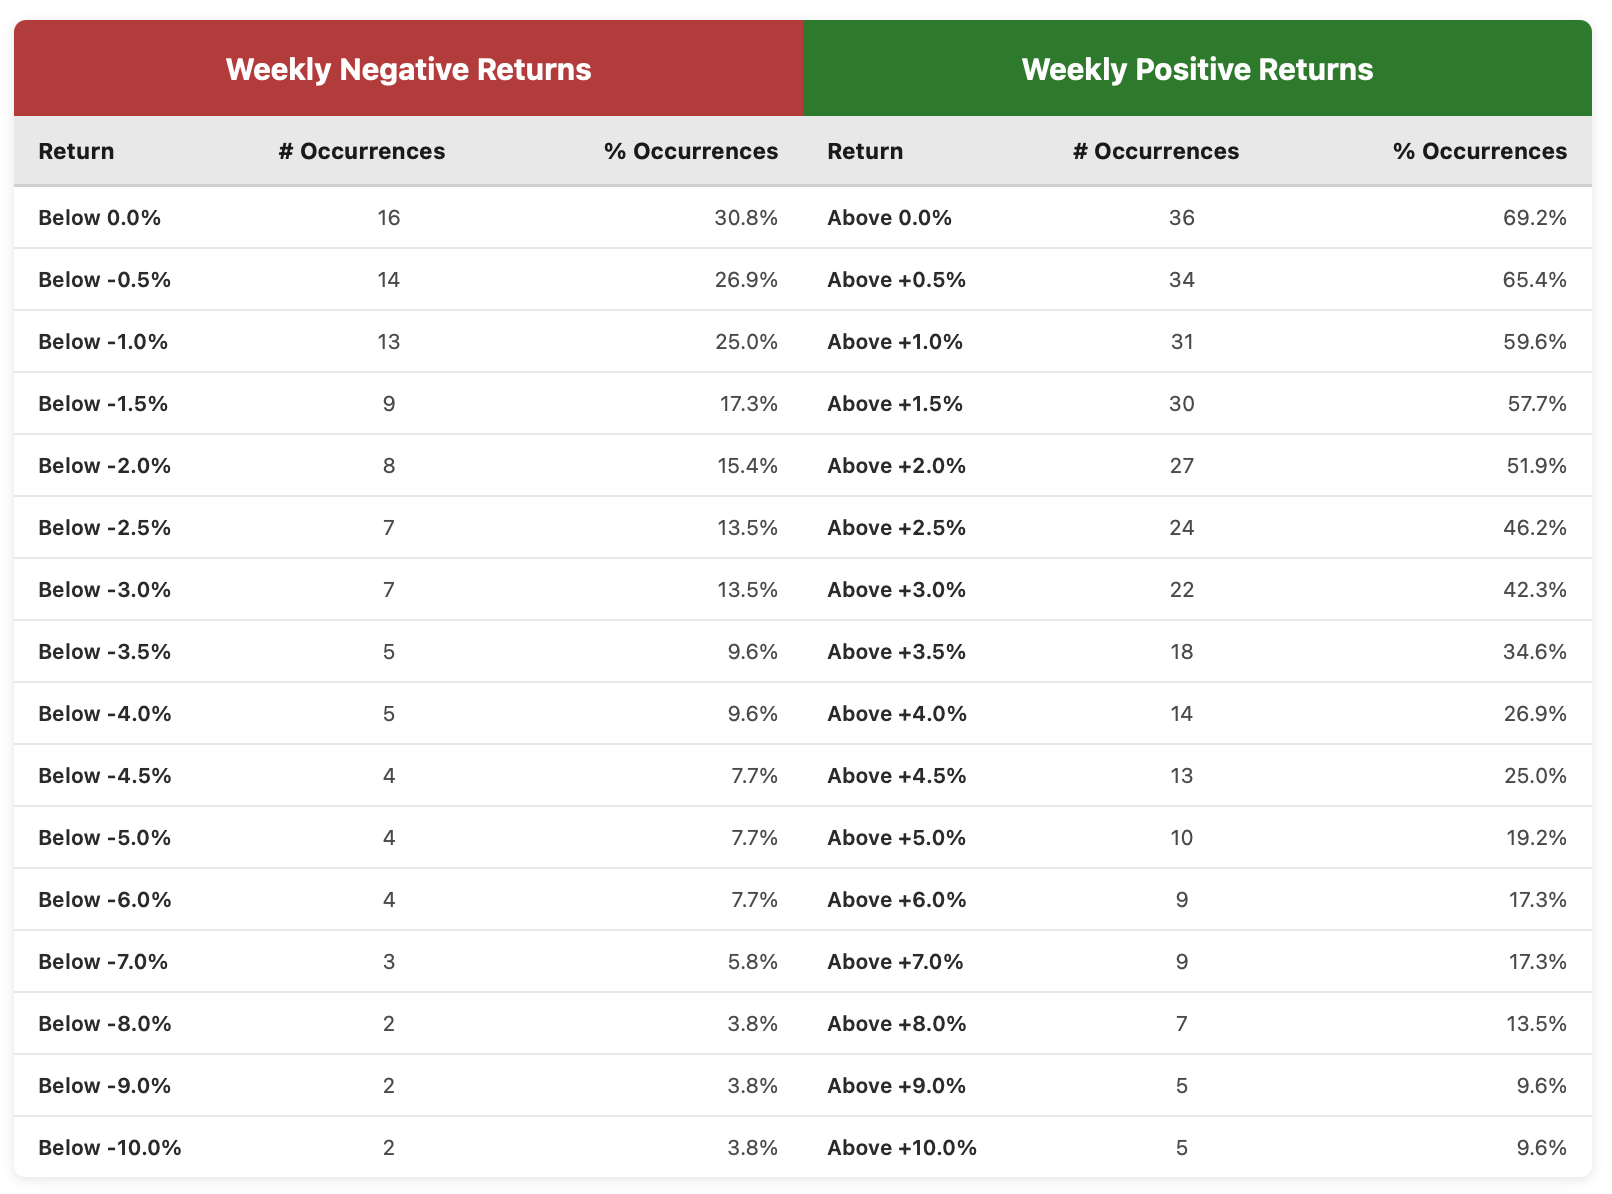
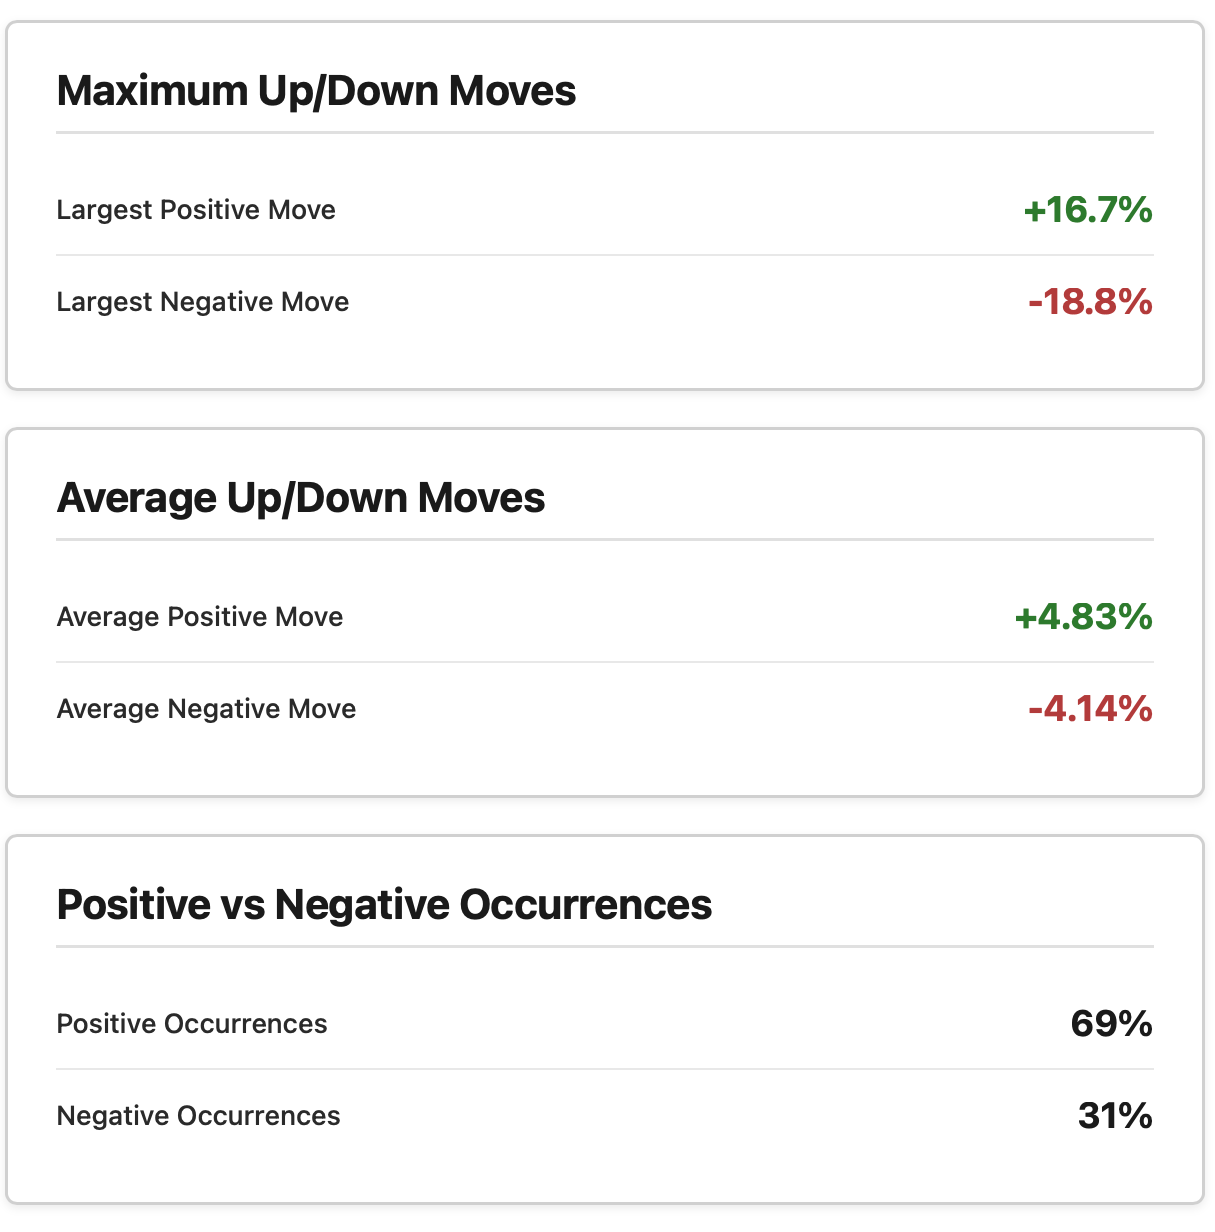
Weekly bullish bias is materially stronger than daily: 69% up-weeks, larger average wins (+4.83% vs +1.99%), and more frequent/big positive outliers.
Downside tail risk is tamed by time aggregation — worst week -18.8% (containing the -28.5% daily crash) vs daily’s far more punishing single-day print.
Implied trading/style implication:
Long bias looks very attractive on a weekly holding/trend-following timeframe (high win rate + favorable avg win/loss).
However, the few losing weeks are still sizeable (multiple -6% to -12% prints), so leverage must remain moderate.
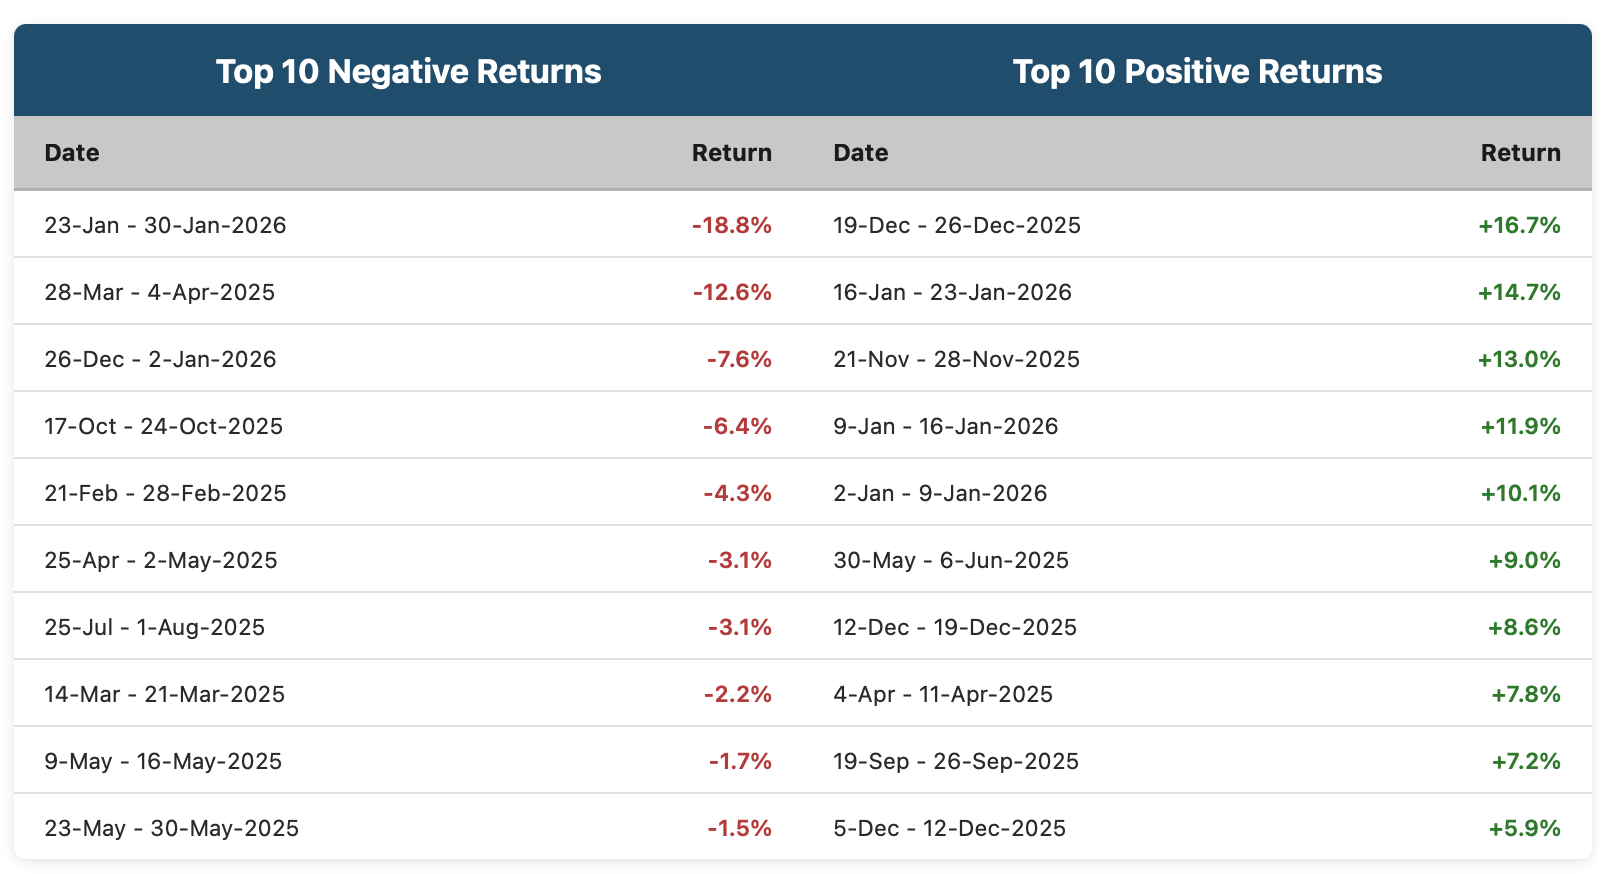
Recent months show extreme two-way volatility — massive +16.7% rally week immediately followed (within ~5 weeks) by -18.8% correction → momentum works until it violently doesn’t.
This profile resembles a classic late-stage bull market in a volatile asset: frequent grinding/accelerating gains punctuated by sharp but infrequent resets.