CI Volatility TradingView signals are built from historical testing and research, refined across thousands of trading days.
What You’ll Get
Automatic All-Time Low Tracking: Continuously updates the ATL using daily timeframe data.
Multiple Spike Levels: Displays +20%, +50%, +75%, and +100% levels above the ATL.
Real-Time Spike Percentage: Shows current distance from ATL in an easy-to-read table.
Watch it in action below:
Understanding the Chart Lines
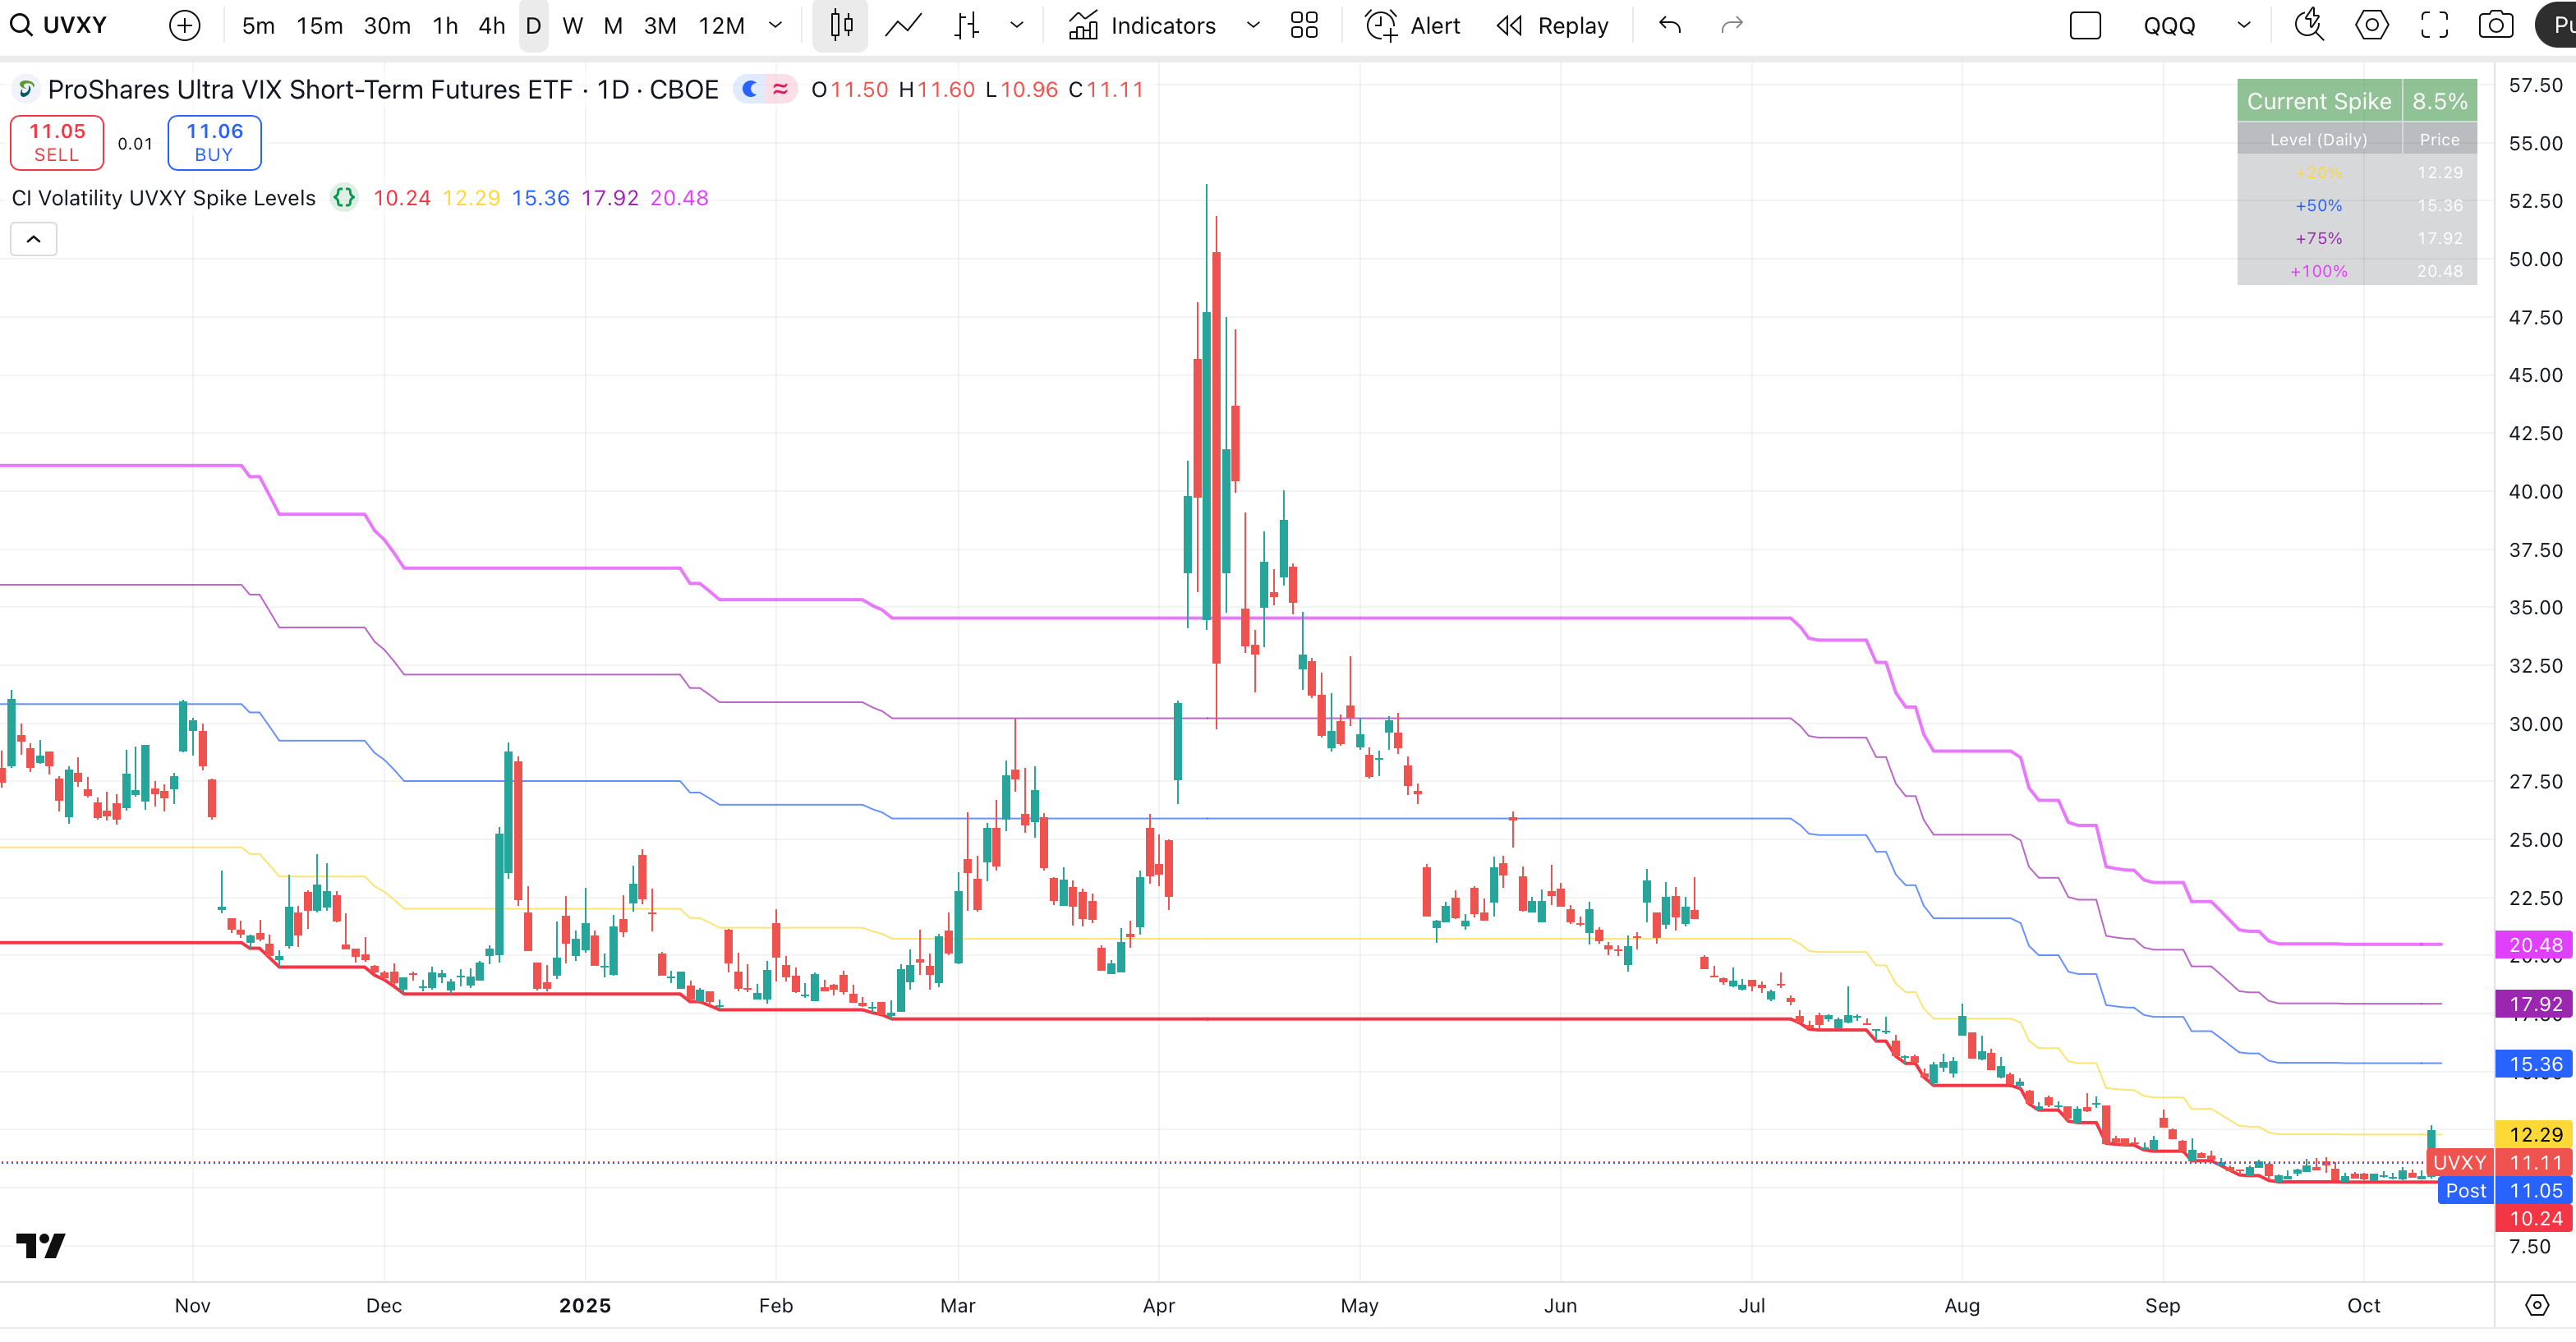
Red Line (ATL): The all-time low baseline. This is your reference point for measuring volatility spikes.
Yellow Line (+20%): First level of moderate volatility increase. Minor market stress or routine volatility expansion.
Blue Line (+50%): Significant volatility event. Indicates elevated market concern or technical dislocation.
Purple Line (+75%): Major volatility spike. Typically coincides with substantial market selloffs or uncertainty.
Fuchsia Line (+100%): Extreme volatility event. Rare occurrences associated with market crashes, black swan events, or severe panic.
The Data Table
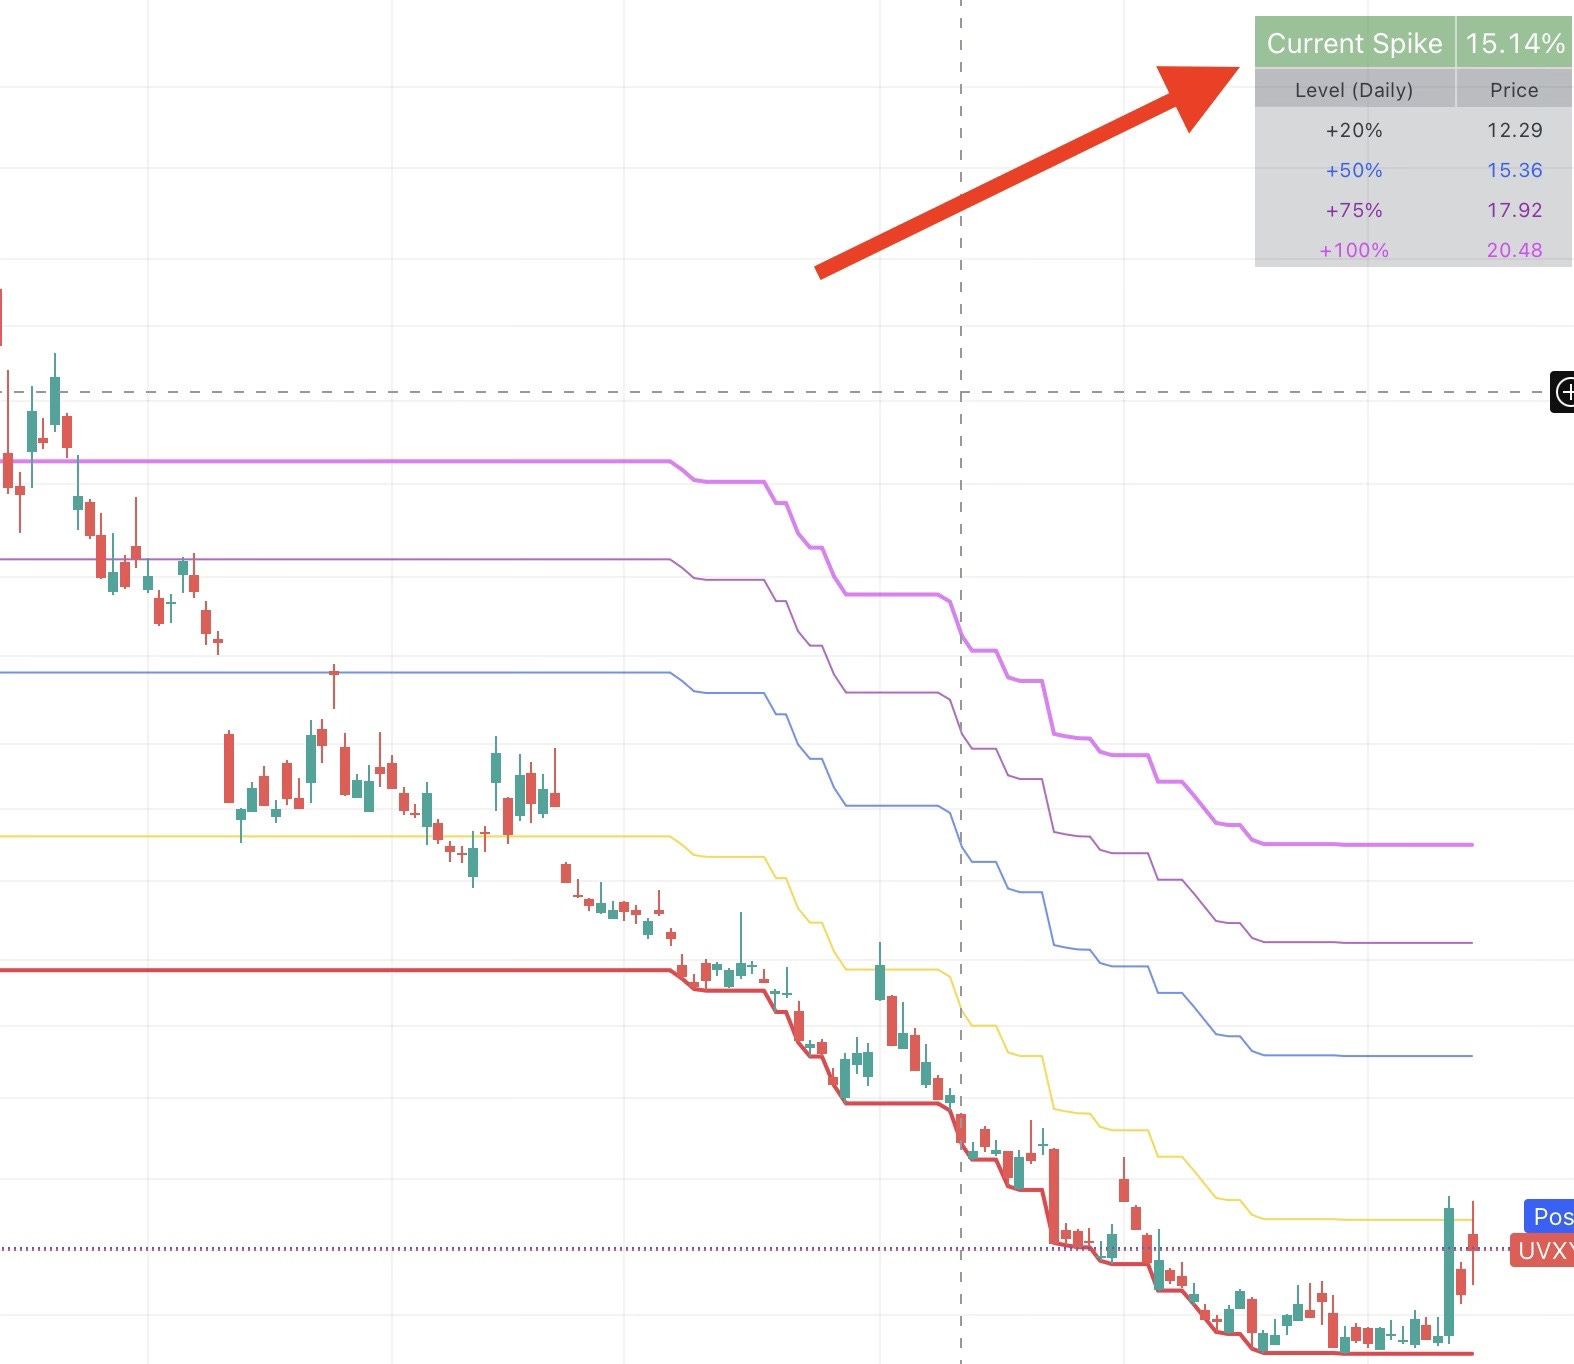
Located in the top-right corner, the table displays:
Current Spike %: Real-time percentage showing how far price is above the ATL (highlighted in green)
Level Column: Each spike threshold level
Price Column: Exact price at each level for quick reference