


When we think of a “golden cross” in stocks, it usually signals the start of a strong uptrend. But the VIX is not a stock and traditional analysis doesn’t often work on it.
By studying golden crosses in the 10/20, 20/50, and 50/200 simple moving averages, we can see how often they occur, how the VIX performs afterward, and whether there’s any predictive edge for traders.
Our Research
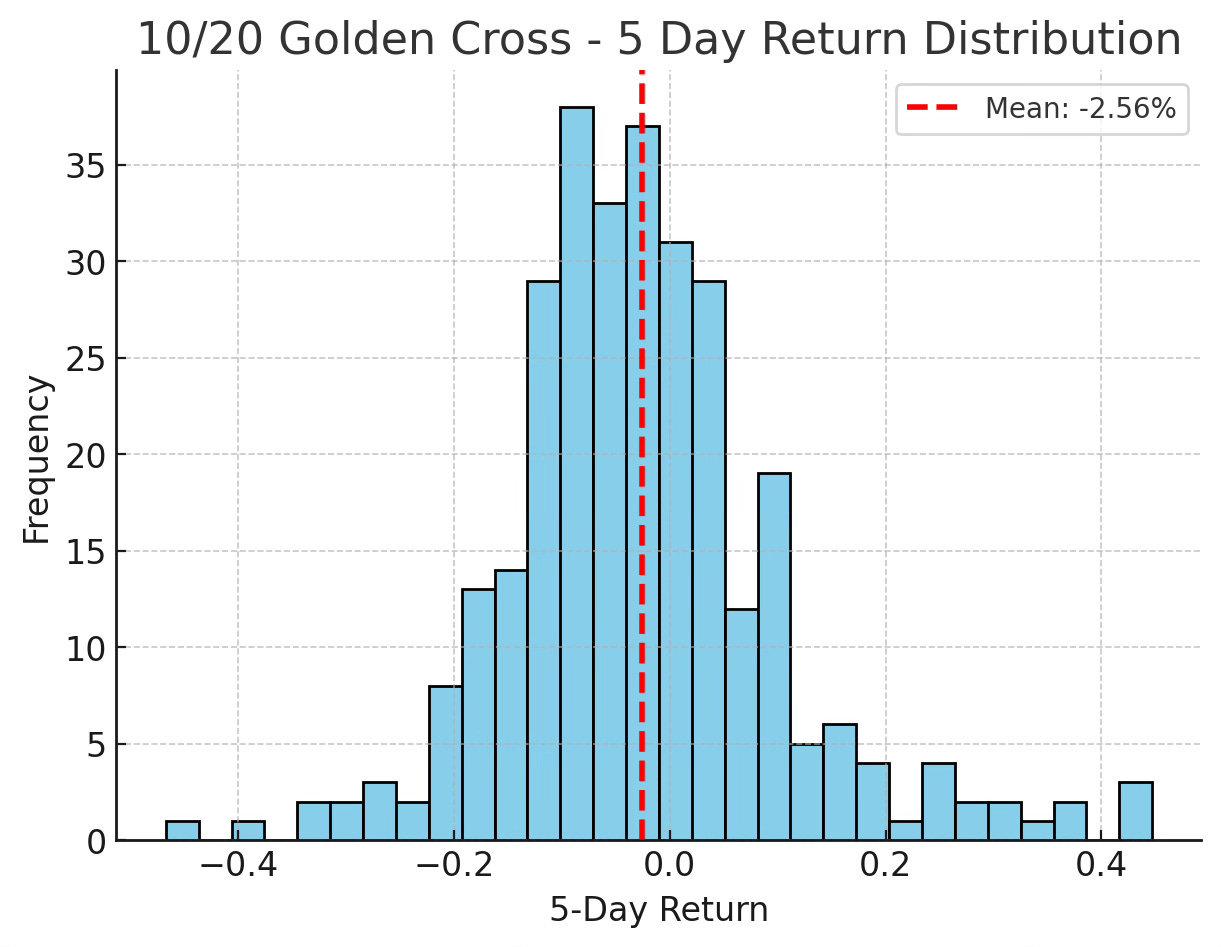
10/20 Golden Cross
Occurrences: 305
Average return after 1 day: –0.88%
Average return after 1 week: –2.56%
1-day outcomes: 40% positive / 60% negative
1-week outcomes: 36% positive / 65% negative
Median time until death cross: 12 days
Average time until death cross: ~14 days
These crosses are common, short-lived (about two weeks), and tend to be followed by lower VIX levels.
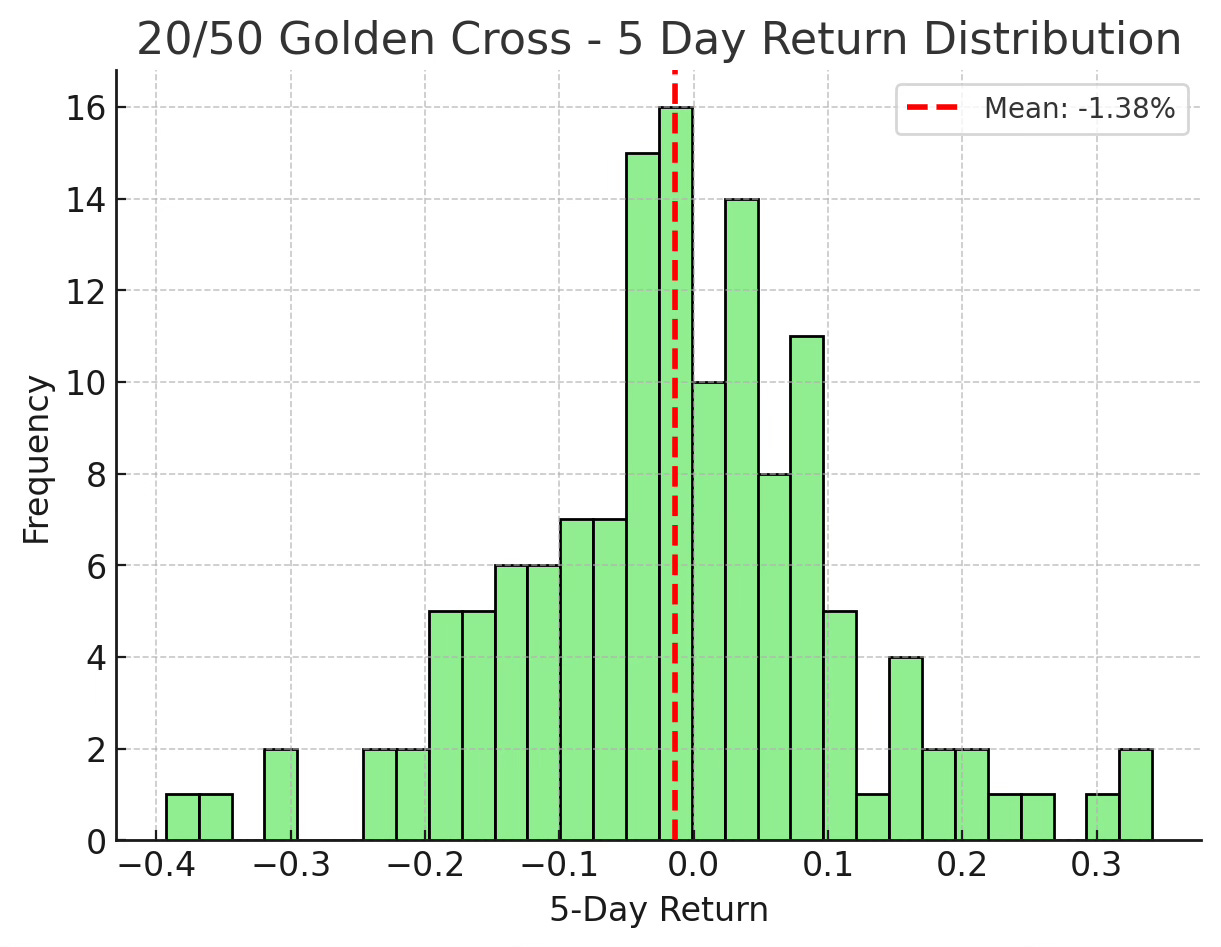
20/50 Golden Cross
Occurrences: 137
Average return after 1 day: +0.30%
Average return after 1 week: –1.38%
1-day outcomes: 45% positive / 55% negative
1-week outcomes: 45% positive / 55% negative
Median time until death cross: 28 days
Average time until death cross: ~30 days
These signals occur less often, last about a month, and while the next-day reaction is slightly positive, the VIX typically drifts lower over the following week.
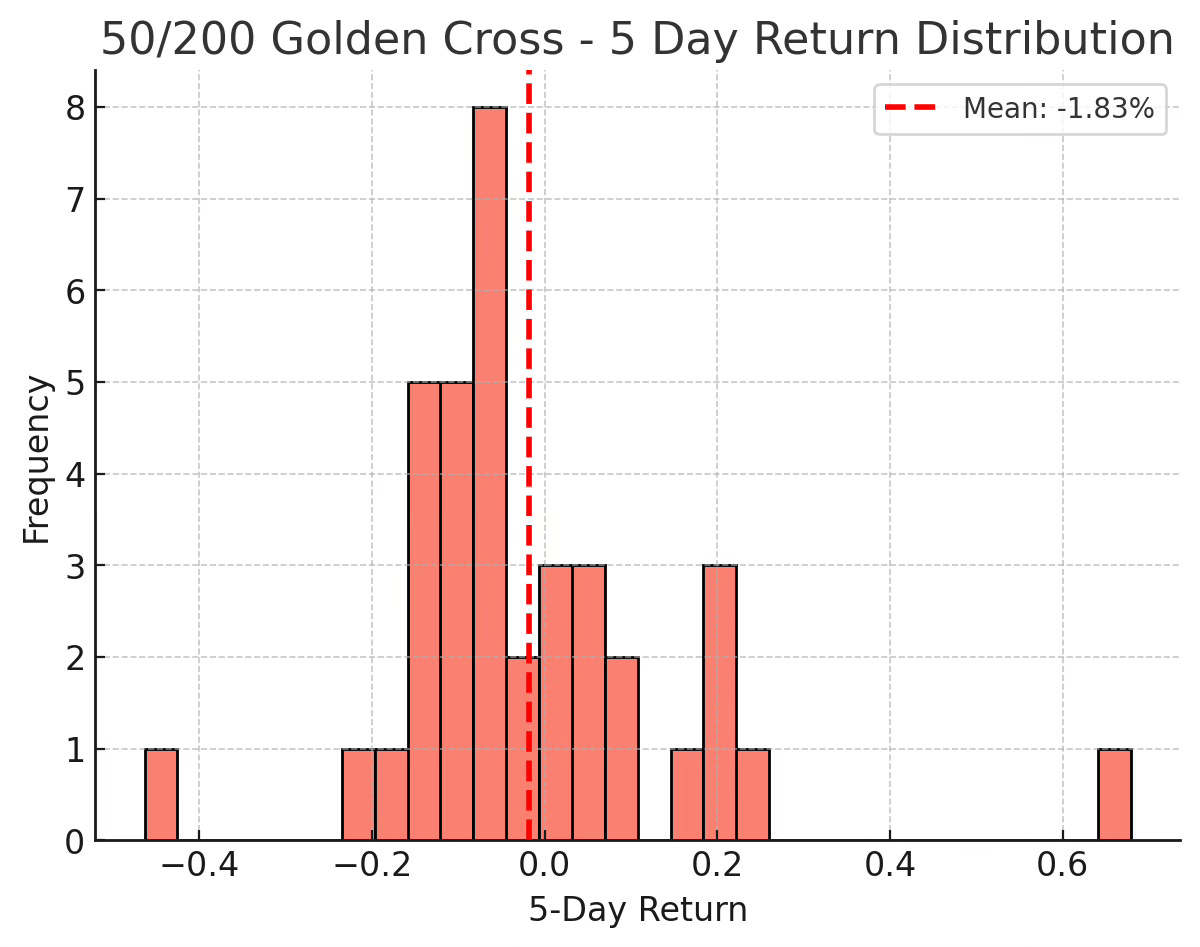
50/200 Golden Cross
Occurrences: 37
Average return after 1 day: +1.15%
Average return after 1 week: –1.83%
1-day outcomes: 38% positive / 62% negative
1-week outcomes: 35% positive / 65% negative
Median time until death cross: 90 days
Average time until death cross: ~92 days
Rare but long-lasting (about 3 months). These crosses usually happen in elevated volatility regimes(average VIX ~22). The next day often sees a sharp spike, but within a week the VIX has usually moved lower again.
Can Traders Use This Information? No!
Next day predictions: Only the 50/200 cross shows consistent upward follow-through on day 1. Shorter crosses usually lead to flat or negative next-day returns.
One week predictions: All three types of crosses show negative drift after 5 trading days. In other words, the VIX tends to be lower one week after a golden cross more often than not.
It’s not a spike signal! In equities, golden crosses often support trend-following. In the VIX, they tend to mark the end of a spike, not the start of one. With less than 45% odds of a positive next-day or next-week return after most golden crosses, they should not be used for going long volatility products.