

The VIX doesn’t behave like a stock when it touches its moving averages. It’s a mean-reverting index that oscillates around a long-term average near 19–20.
To prove this point, we tested the 5, 10, 20, 50, and 200-day simple moving averages (SMAs) from 1990 to 2025 and tracked the performance afterward.
Key Statistics for Each SMA Touch
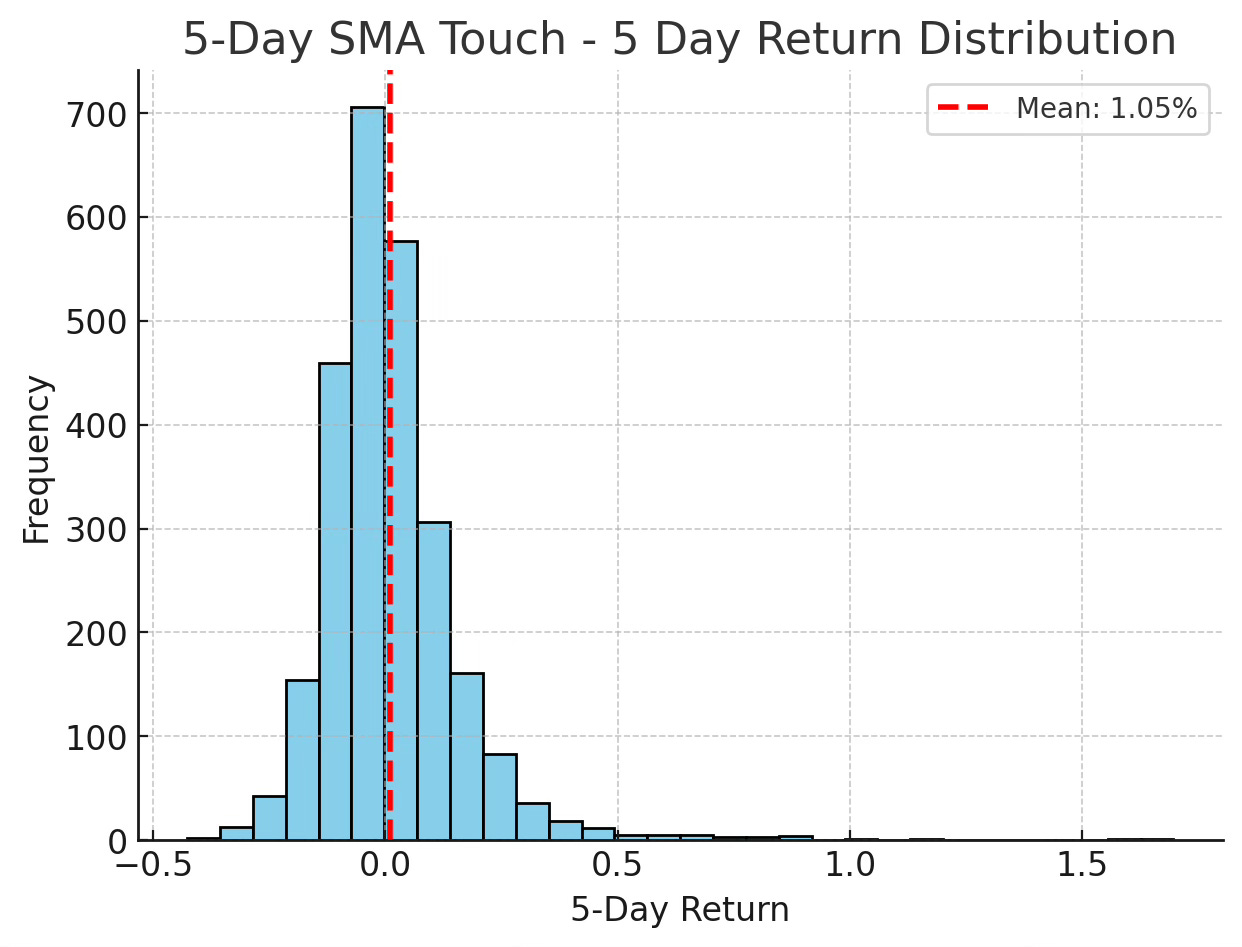
5-Day SMA
Occurrences: 2,601
Average next-day return: +0.10%
Average 1-week return: +1.05%
1-day outcomes: 46% positive / 53% negative
1-week outcomes: 46% positive / 54% negative
Median days to revert: 3
Average days to revert: ~3.5
Avg VIX level at touch: ~19.3
Very frequent — roughly once every 3–4 trading days. Quick reversion in about 3 days.
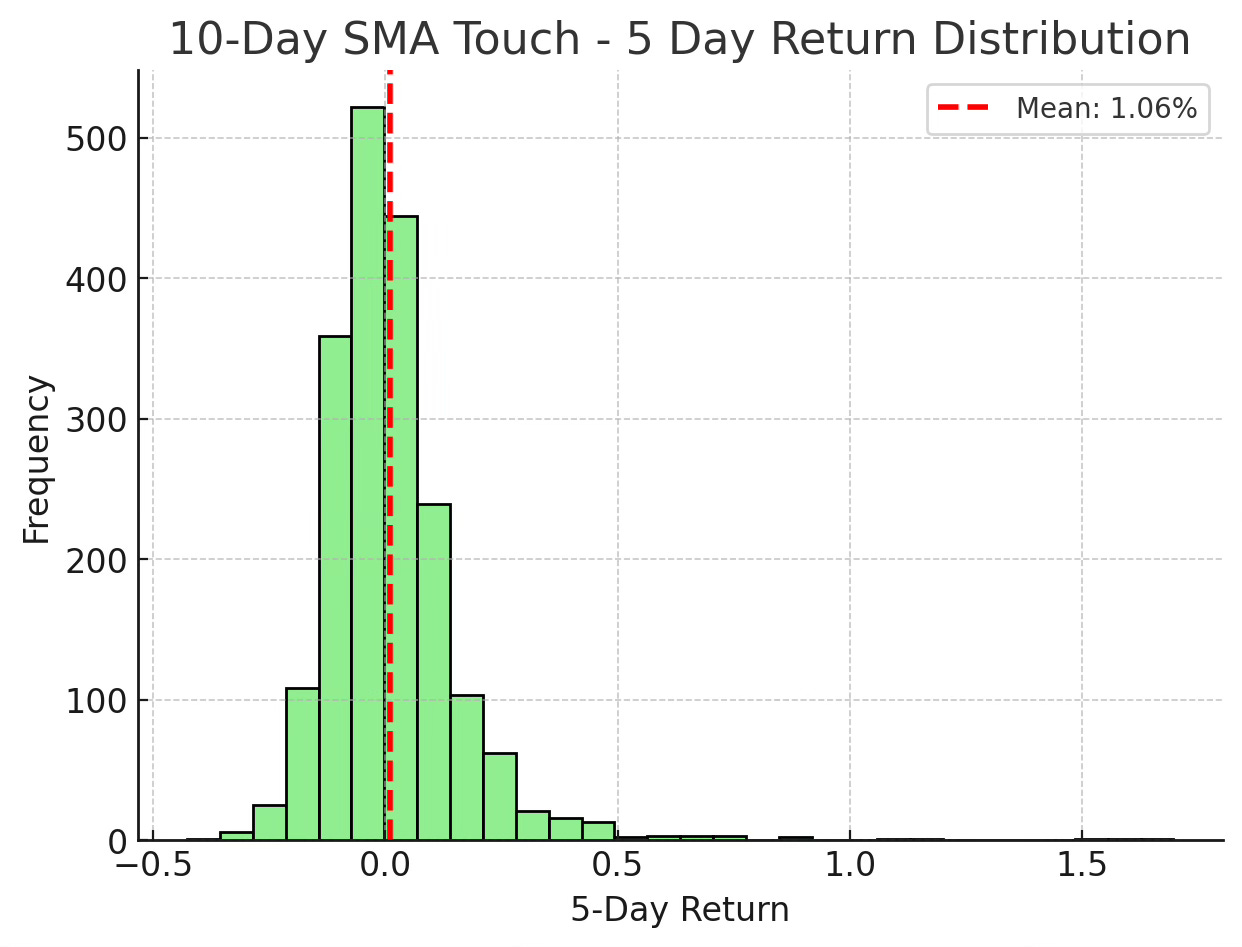
10-Day SMA
Occurrences: 1,938
Average next-day return: +0.33%
Average 1-week return: +1.06%
1-day outcomes: 46% positive / 54% negative
1-week outcomes: 46% positive / 54% negative
Median days to revert: 3
Average days to revert: ~4.6
Avg VIX level at touch: ~19.0
Slightly stronger short-term drift than the 5-day, but still mean-reverts in under a week.
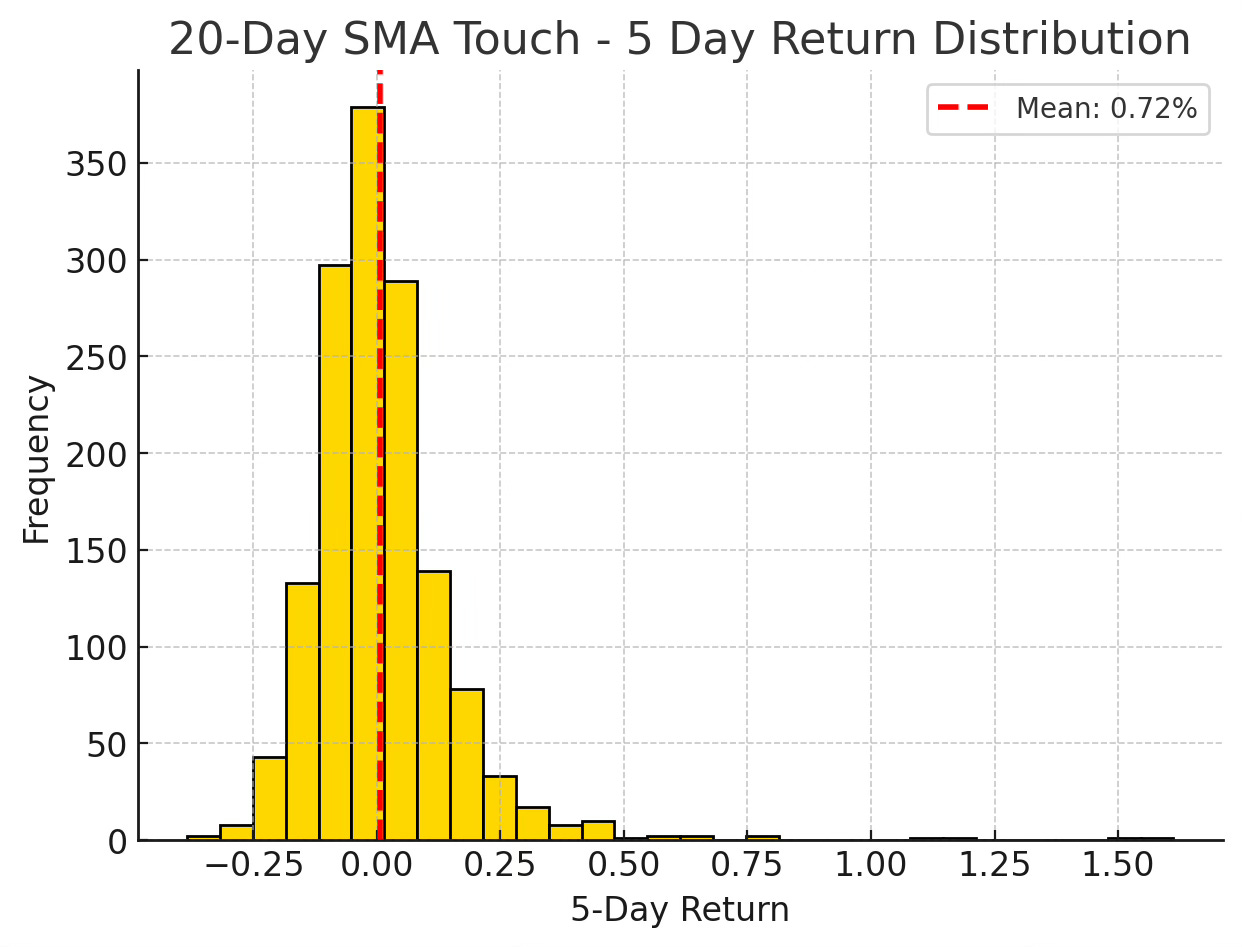
20-Day SMA
Occurrences: 1,448
Average next-day return: +0.19%
Average 1-week return: +0.72%
1-day outcomes: 46% positive / 53% negative
1-week outcomes: 47% positive / 53% negative
Median days to revert: 3
Average days to revert: ~6.2
Avg VIX level at touch: ~18.9
Touches are less frequent, and the VIX tends to hover longer before reverting.
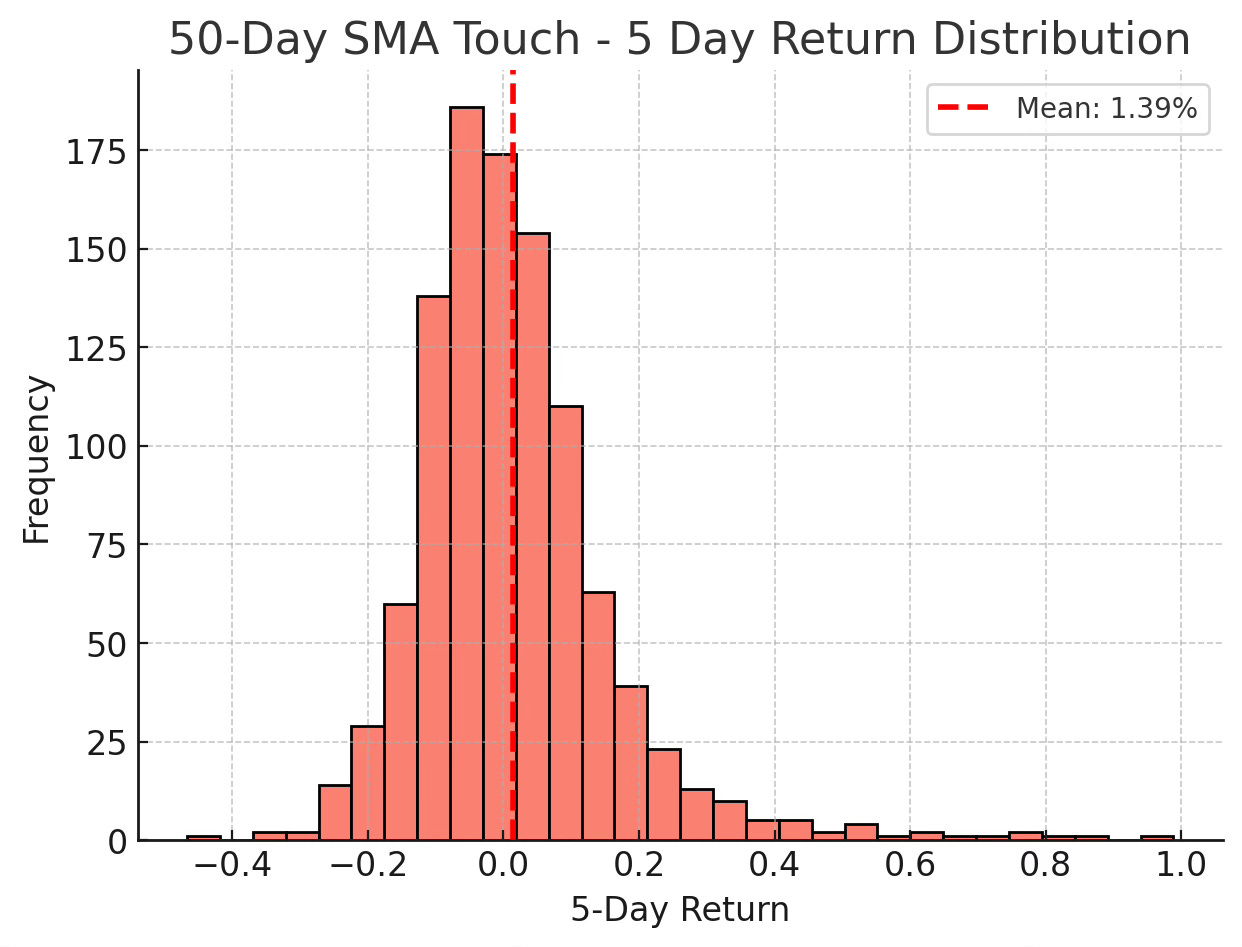
50-Day SMA
Occurrences: 1,046
Average next-day return: +0.01% (flat)
Average 1-week return: +1.39%
1-day outcomes: 43% positive / 57% negative
1-week outcomes: 48% positive / 51% negative
Median days to revert: 3
Average days to revert: ~8.6
Avg VIX level at touch: ~18.5
Signals happen ~28 times per year. They linger longer, with mean reversion stretching toward 2 weeks.
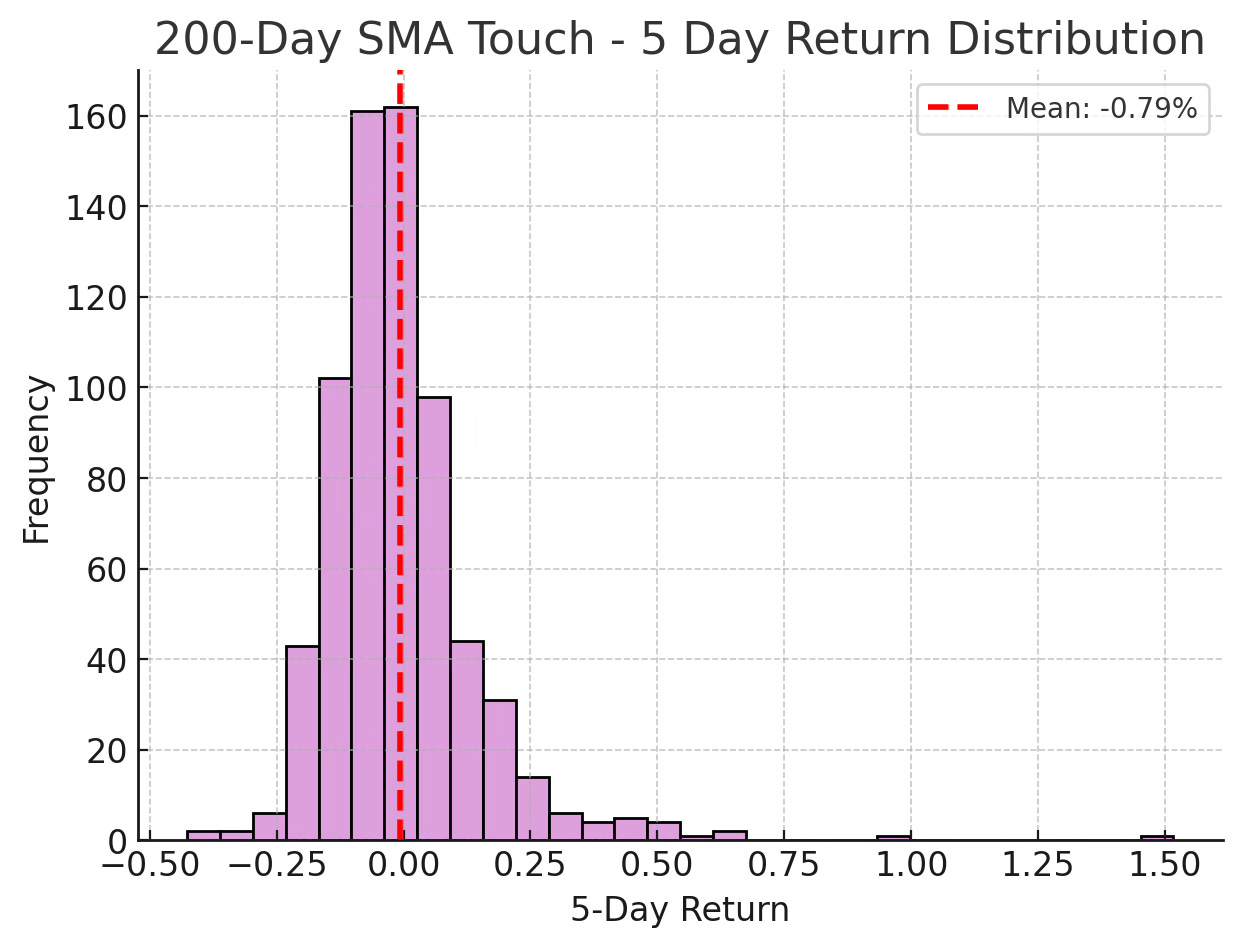
200-Day SMA
Occurrences: 689
Average next-day return: –0.33%
Average 1-week return: –0.79%
1-day outcomes: 43% positive / 56% negative
1-week outcomes: 39% positive / 61% negative
Median days to revert: 3
Average days to revert: ~12.7
Avg VIX level at touch: ~18.3
Rare — only about 19 per year. These touches usually occur when VIX is calm. Reversions are the slowest, averaging over 2 weeks.
Can Traders Use This Information?
Not as a trend signal. Unlike stocks, where moving average touches can signal momentum, the VIX’s touches mainly highlight its mean-reverting nature.
Next-day predictability is weak. None of the SMAs show more than ~46% positive outcomes; the VIX is nearly a coin flip the next day.
One week later: There’s a slight bias toward negative outcomes, especially at the 200-day SMA, where the VIX is lower about 61% of the time.
For traders, these signals are best viewed as context about market fear returning toward normal, not as actionable “buy volatility” opportunities.