


Picture the market like the ocean.
The waves you see are daily stock price moves.
But underneath currents shape everything.
Those undercurrents are called gamma.
Negative vs Positive Gamma
Gamma measures how aggressively market makers hedge their risk from the options they’ve sold to traders — we say “sold” because most traders are buying options from the market makers.
When investors buy calls or puts, someone has to take the other side of that trade.
That “someone” is usually a market maker (a firm like Citadel) who sells the options and then constantly buys or sells the underlying stock to keep their overall position neutral.
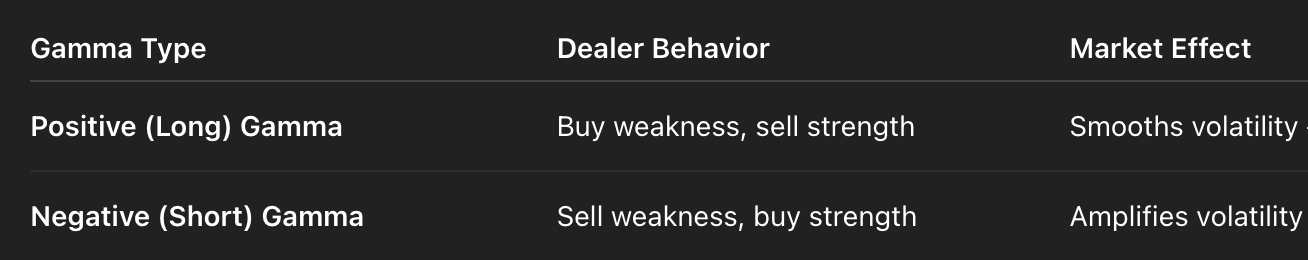
The way they hedge depends on whether they are in negative or positive gamma:
The Gamma Flip
The Gamma Flip Point marks where the overall options market shifts from positive to negative gamma.
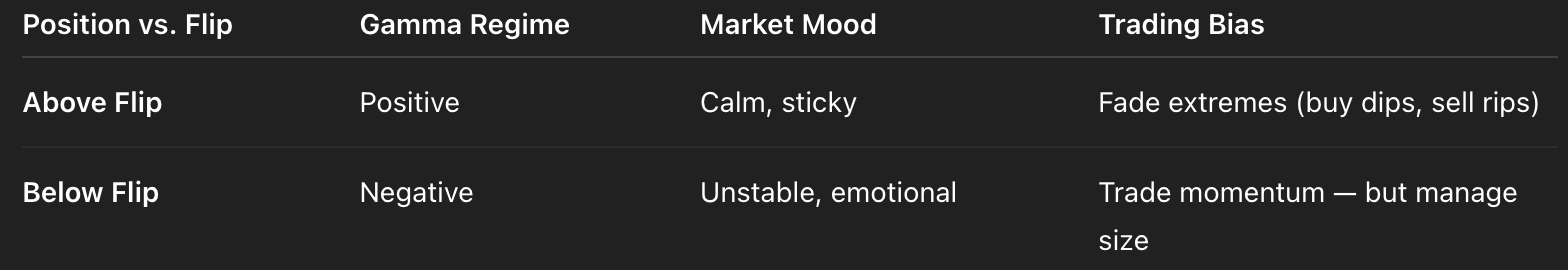
Above the flip: Positive gamma → Dealers’ hedging fights against price movement — it dampens volatility and stabilizes the market.
Below the flip: Negative gamma → Dealers’ hedging chases the price — it adds fuel to momentum and makes moves larger and faster.
Negative Gamma (Below the Flip)
Negative gamma usually appears after markets start falling.
When stocks drop, volatility spikes, and option values rise — this flips dealers into short gamma.
Here’s the chain reaction:
Prices fall → Dealers sell stock to hedge their short puts.
Their selling pushes prices lower, creating more hedging pressure.
Feedback loop forms — the lower it goes, the more they must sell.
This is why down moves under negative gamma are fast.
But this doesn’t last forever.
Eventually, selling pressure slows, traders start buying, and dealers’ hedges unwind in reverse.
Then comes the snapback:
Dealers buy to rebalance.
Volatility collapses.
The rebound accelerates — often violently.
So yes — negative gamma does align with falling markets initially,
but once that selling pressure burns out, the reverse feedback can trigger some of the sharpest rallies in history.
Positive Gamma (Above the Flip)
Above a key level known as the Gamma Flip, dealers’ hedging becomes stabilizing instead of reactive.
In this positive gamma environment:
Dealers buy when prices dip, sell when prices rise.
This absorbs volatility
Breakouts fade, ranges tighten, and volatility stays muted.
That’s why quiet, steady uptrends usually happen in positive gamma conditions.
How to Trade Gamma Flips
When the market drops below the flip, expect higher volatility and fast moves.
Don’t rush to fade the first drop — wait until momentum slows, then look for a reversion back toward the flip.
Example: Reading a Real Gamma Map
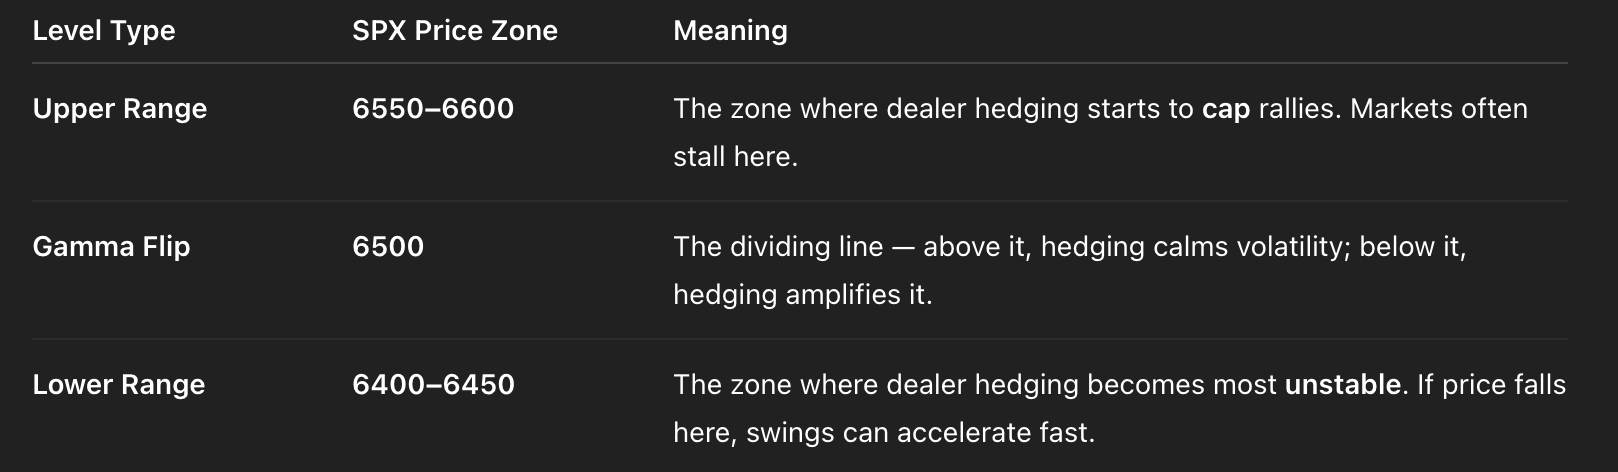
Let’s imagine that today’s SPX gamma levels look like this:
How to Interpret It
Above 6500 (Positive Gamma):
The market is in the “calm zone.” Dealers’ hedging absorbs volatility — they buy dips and sell rips.Below 6500 (Negative Gamma):
The market enters a “chaotic zone.” Dealer hedging now chases price moves — selling into declines, buying into rallies.
Volatility expands, trends extend, and false reversals become common.Lower Range (6400–6450):
This is the “danger zone.” Dealer hedging becomes very one-sided, and liquidity thins out.
That’s where panic spikes or squeezes often occur — violent, fast, and emotional moves in both directions.
Why Gamma Dashboards Show Upper, Flip, and Lower Wall
Most gamma services publish three main zones each day:
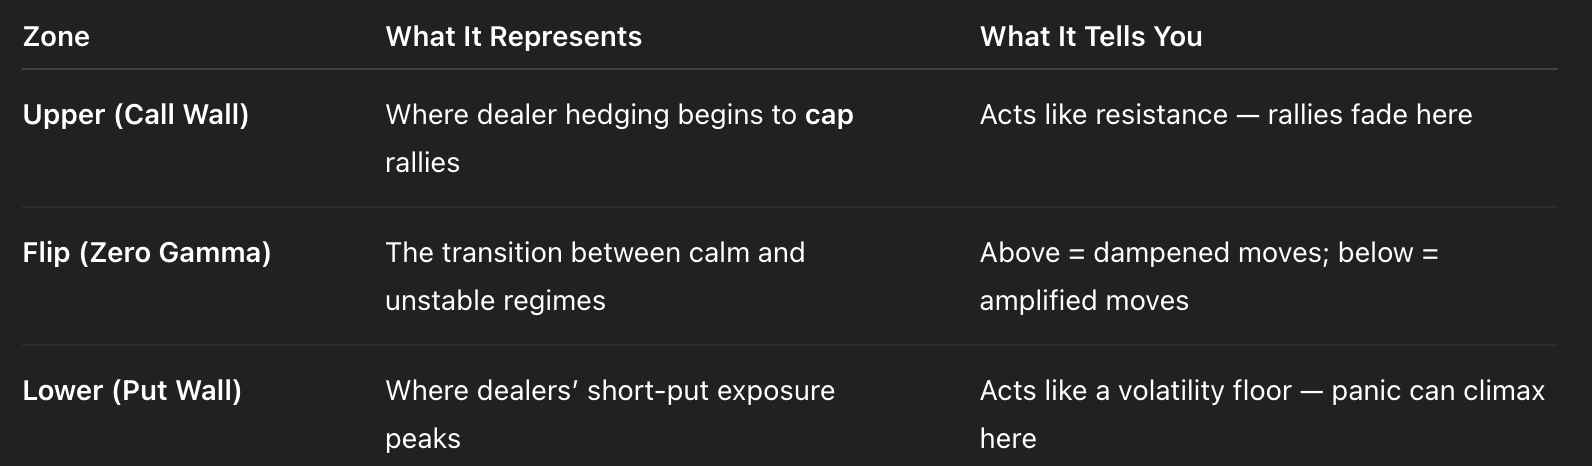
Think of it as a volatility map:
Above the flip, the market feels sticky and controlled.
Below it, it feels unanchored and emotional.
Near the lower wall, it’s often near exhaustion, where the next big rebound can begin.
Near the upper wall, dealer hedging typically caps further upside, causing upward price to slow or stall.
Quick Practical Example
Let’s say SPX opens at 6520 — above the 6500 flip.
You’re in positive gamma. Expect a calm, pinned market.
If SPX drifts to 6550, that’s near the upper gamma zone. A logical place for resistance.
But if SPX sells off to 6450, it’s now below the flip — negative gamma territory.
Expect faster, wider moves and more intraday volatility.
If price stabilizes around 6450 and starts turning up, that can spark a gamma squeeze back toward 6500.
So one number changes everything about how you interpret the market’s mood.